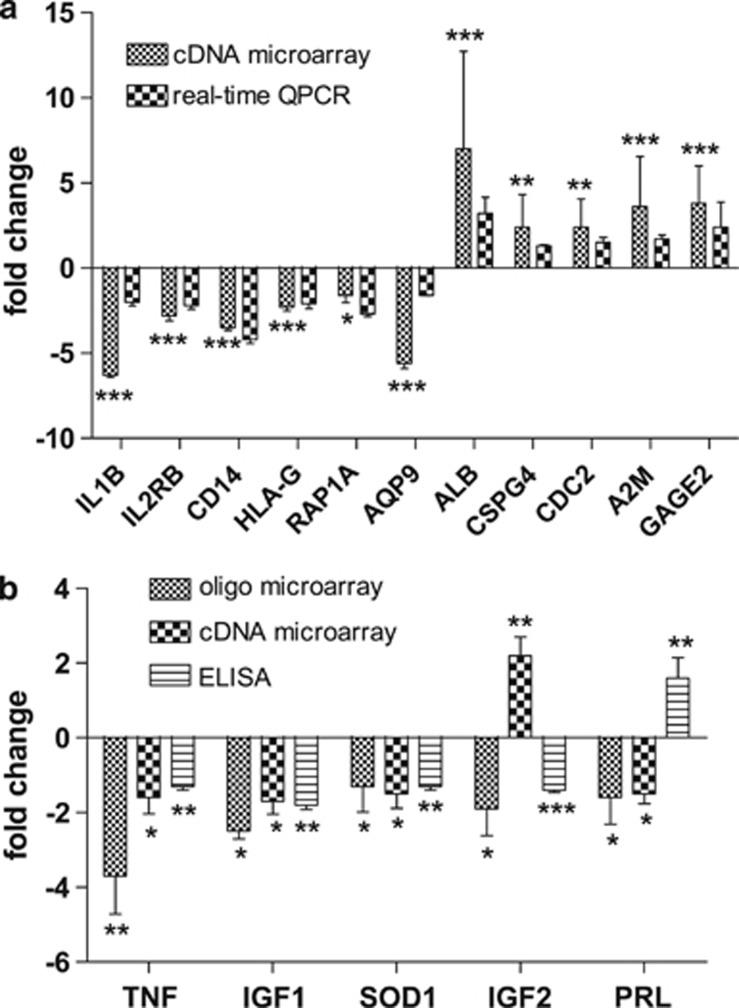
Figure 3.
Comparison of transcript levels determined by two different assays and comparison of transcript levels with plasma protein levels. (a) Correlation of real-time QPCR and cDNA microarray data: real-time PCR reactions for each gene were carried out with three or more replicates. Trizol RNA isolation and cDNA microarrays were used. Significance levels: *0.001⩽q<0.05, **1.0E-5⩽q<0.001, ***q<1.0E-5—q stands for P-values after FDR correction. (b) Plasma protein concentrations (ELISA) compared with transcript levels (oligo and cDNA microarray): plasma concentrations of PRL, IGF1 and IGF2, TNFα and enzymatic activity of superoxide dismutase 1 (SOD1) assays were performed in triplicate on the plasma of 9 of the 10 soldiers who completed RASP. The IGF-I depletion is consistent with the finding of other investigators who measured its plasma concentration on similar subjects15 (*0.01⩽P<0.05, **0.001⩽P<0.01, ***P<0.001).

