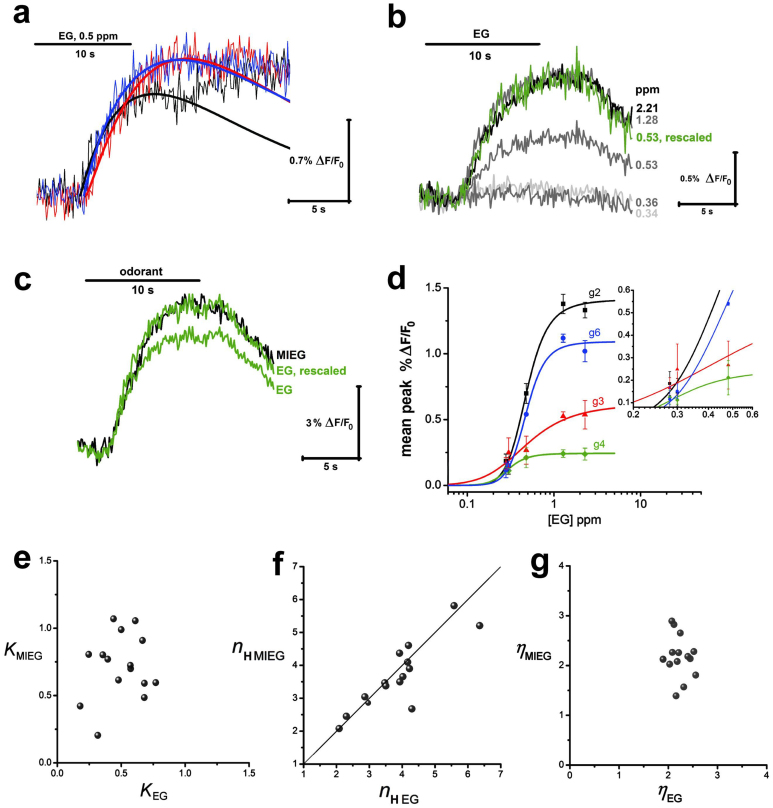
Figure 2. Dynamics and concentration dependence of EG- and MIEG-evoked spH fluorescence responses in individual glomeruli.
(a). Raw traces showing inter-trial variation of the rising phases and peaks of the relative change, ΔF/F0, in spH fluorescence of a glomerulus evoked by repeated, semi-randomized odorant stimuli (EG, 0.5 ppm). Alpha function curve fits to the data (see Methods) are overlaid for each raw data trace. Horizontal bar shows timing and duration of odorant pulses. (b). Dose-dependence of ΔF/F0 responses of another glomerulus to EG. Gray traces show responses to stimuli delivered at ascending concentrations as indicated to the right of each trace, with saturation occurring at > 1.28 ppm. Time courses of responses were concentration invariant at intermediate and higher doses, as shown by overlay of a rescaled 0.53 ppm response (green trace) and maximum 2.21 ppm response. Similar data were obtained for responses to MIEG. (c). Odorant stimulus invariance of the time courses of ΔF/F0 responses of a third glomerulus to EG (1.68 ppm, green traces) and MIEG (4.65 ppm, black trace). Upper green trace shows how the time course of the EG response could be rescaled to match the time course of the MIEG response. Horizontal bars in (a–c) show timing and duration of odorant pulses. Rescaling factors in (b) and (c) were obtained by minimizing areas between responses. (d). Dose-response profiles of peak EG responses of four glomeruli (g2, g3, g4, g6) from the same animal, recorded in the same experiment. Plotted points represent values averaged over 3 trials (mean ± SD). Fitted curves were obtained from a modified Hill equation (see Eqn (1) in text) with parameters (Fmax, K, nH ,η) values of: g2 (1.43, 0.49, 6.82, 2.01); g3 (0.73, 0.52, 2.74, 1.85); g4 (0.24, 0.49, 6.31, 2.64); g6 (1.09, 0.96, 5.86, 3.01). Inset: magnified view near threshold highlighting the variability in fits for different glomeruli. (e–g). Scatter plots of values of the parameters K, nH, η obtained from 15 glomeruli by fitting dose-response relations for odorants EG and MIEG to Eqn (1). Line in (f) indicates diagonal axis.

