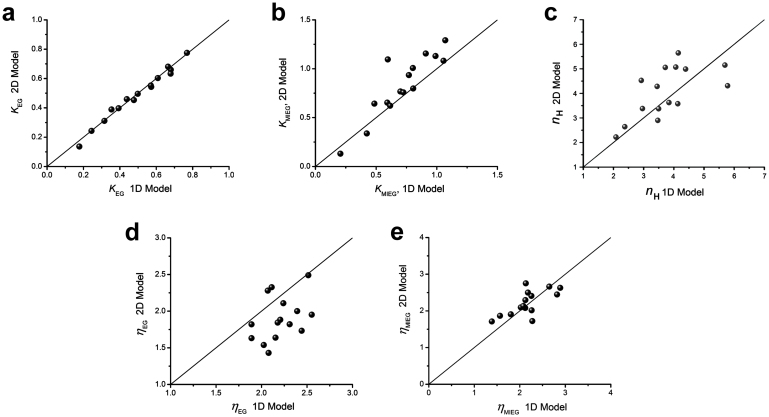
Figure 4. Comparison of parameters from 1D (single odorant) and 2D (binary mixture) model fits.
Scatter plots of 2D vs. 1D parameters: (a) KEG; (b). KMIEG; (c). nH; (d). ηEG; (e). ηMIEG. The 1D values were obtained from fits of receptor binding, activation and transduction model, Eqn (1), to single odorant dose response data; the 2D values from fits of competitive binary interaction model, Eqn (2), to mixture dose response data. Diagonal reference lines are drawn to show how well 1D values predicted 2D values. Linear regression yielded significant correlations between 1D and 2D values except for ηEG, which had small overall variation, with values closely clustered around ηEG = 2. Pearson's correlation coefficients were: KEG, r = 0.9905, P < 0.001; KMIEG, r = 0.8968, P < 0.001; nH, r = 0.6379, P = 0.0105; ηEG, r = 0.3874, P = 0.1537; ηMIEG, r = 0.6844, P = 0.0049.

