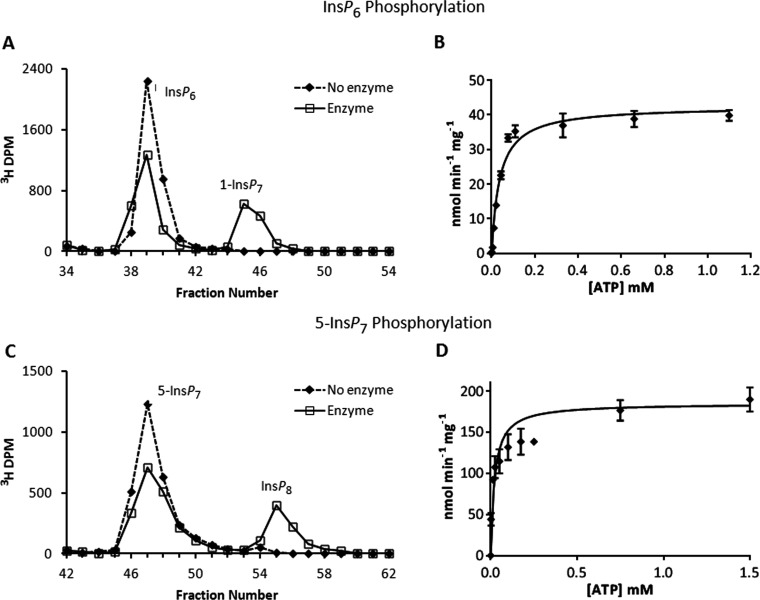
Figure 3. Phosphorylation reactions of PPIP5K2KD and substrate saturation plots for ATP and ADP.
(A) Either no enzyme (broken line) or 27 μg/ml PPIP5K2KD (solid line) was incubated with 10 μM [3H]InsP6, and 11 μM ATP for 20 min as indicated in the Materials and methods section. The reactions were quenched and neutralized and analysed by Partisphere SAX HPLC as described in the Materials and methods section. Representative HPLC data are shown. (B) The initial velocity of InsP6 phosphorylation was determined for forward reactions under pseudo first-order rate conditions [38] in which the concentration of the designated inositol phosphate was fixed at saturating levels (10 μM; Table 1), and the concentration of nucleotide was varied as indicated. Each individual data point was analysed by HPLC as described under the Materials and methods section. The Michaelis–Menten equation was fitted to the data using non-linear regression (GraphPad Prism v5.03). Results are presented as the means±S.E.M. (C) Either no enzyme (broken line) or 0.011 μg/ml PPIP5K2KD (solid line) was incubated with 100 nM 5-[3H]InsP7 and 10 mM ATP for 7 min as indicated in the Materials and methods section. The reactions were quenched and neutralized and analysed by Partisphere SAX HPLC as described in the Materials and methods section. Representative HPLC data are shown. (D) The initial velocity of 5-InsP7 phosphorylation was determined as described in the legend to panel (B) for InsP6.

