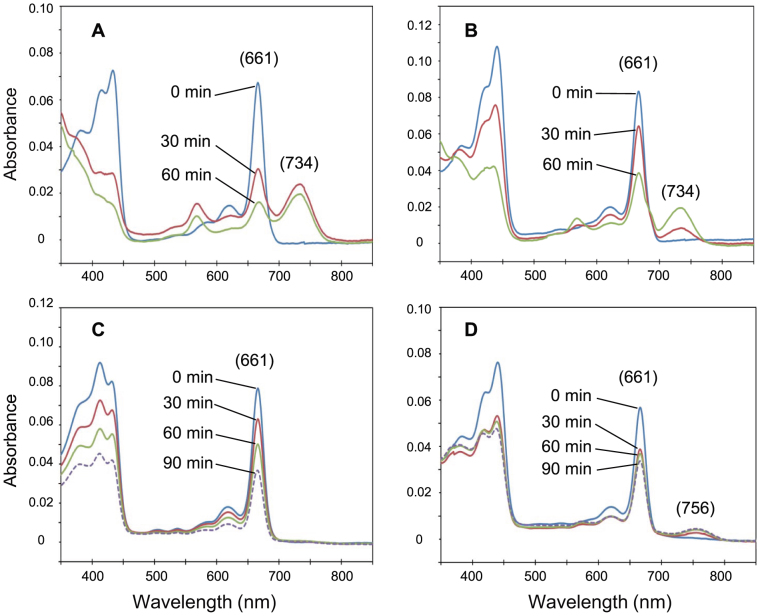
Figure 2. Changes in absorption spectra of enzymatic assay mixtures.
Absorption spectra were recorded in 80% acetone (20% aqueous buffer). R. capsulatus COR was mixed with Chlide a (A) and 8V-Chlide a (B). B. viridis COR was mixed with Chlide a (C) and 8V-Chlide a (D). The Qy absorption peaks of the substrates and products are shown in parentheses.

