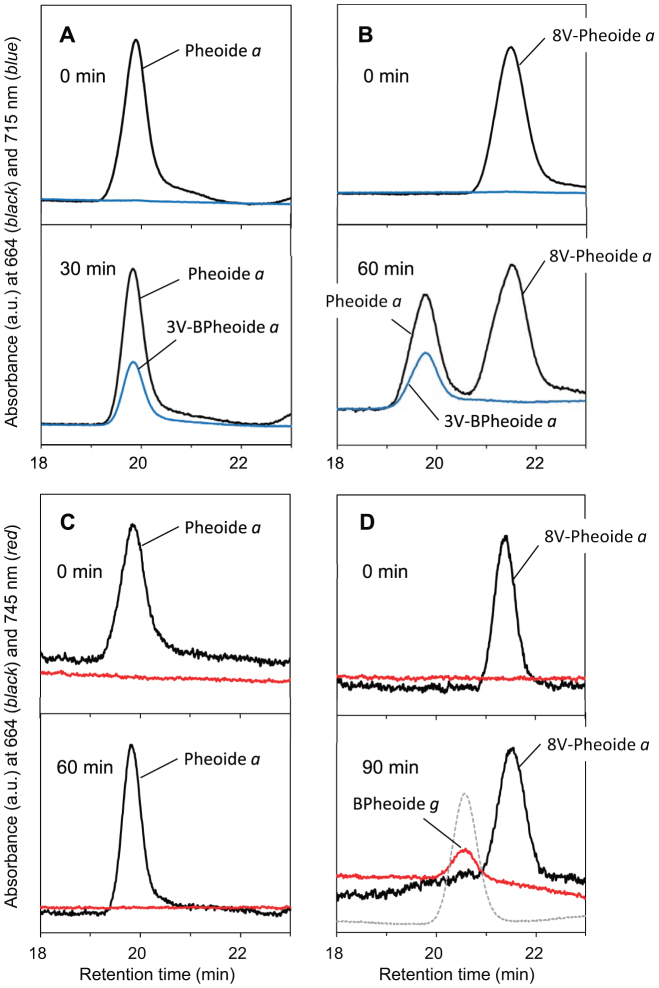
Figure 3. Reverse-phase HPLC analysis of pigments formed in the COR assays after acidic pheophytinization.
R. capsulatus COR was mixed with Chlide a (A) and 8V-Chlide a (B), and B. viridis COR was mixed with Chlide a (C) and 8V-Chlide a (D). Elution profiles were measured at 664 nm (black line) to monitor Chlide pigments, and 715 nm (blue line) and 745 nm (red line) to monitor BChlide pigments. Upper and lower panels of columns represent elution profiles before and after incubation, respectively: incubation time is described in each panel. In (D), an elution profile of the BPheoide g standard is shown as gray dashed line.

