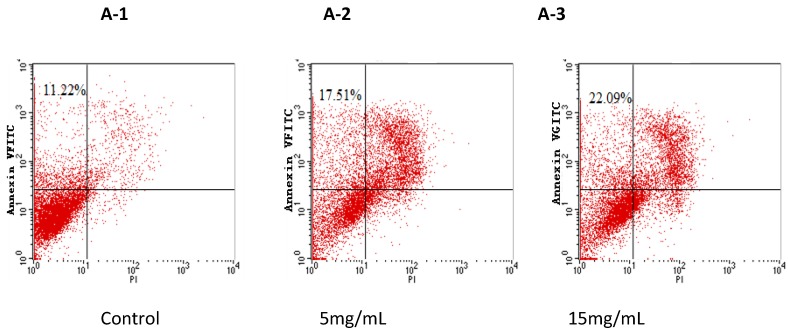
Figure 5.
Flow cytometry analysis of PC-3 cells by double-labeling with Annexin-V fluorescein isothiocyanate (FITC) and PI. Quadrants: Lower left—the live cells. Upper left—the early apoptotic cells. Lower right—the necrotic cells, and upper right—late apoptotic cells. Percentages of early apoptotic cells were: (A-1) control cells: 11.22% ± 1.2%; (A-2) BEPT II-1 (5 mg/mL): 17.51% ± 1.0%; (A-3) BEPT II-1 (15 mg/mL): 22.09% ± 2.1%;One representative fluorescence activated cell sorting (FACS) assay of three independent experiments is presented.

