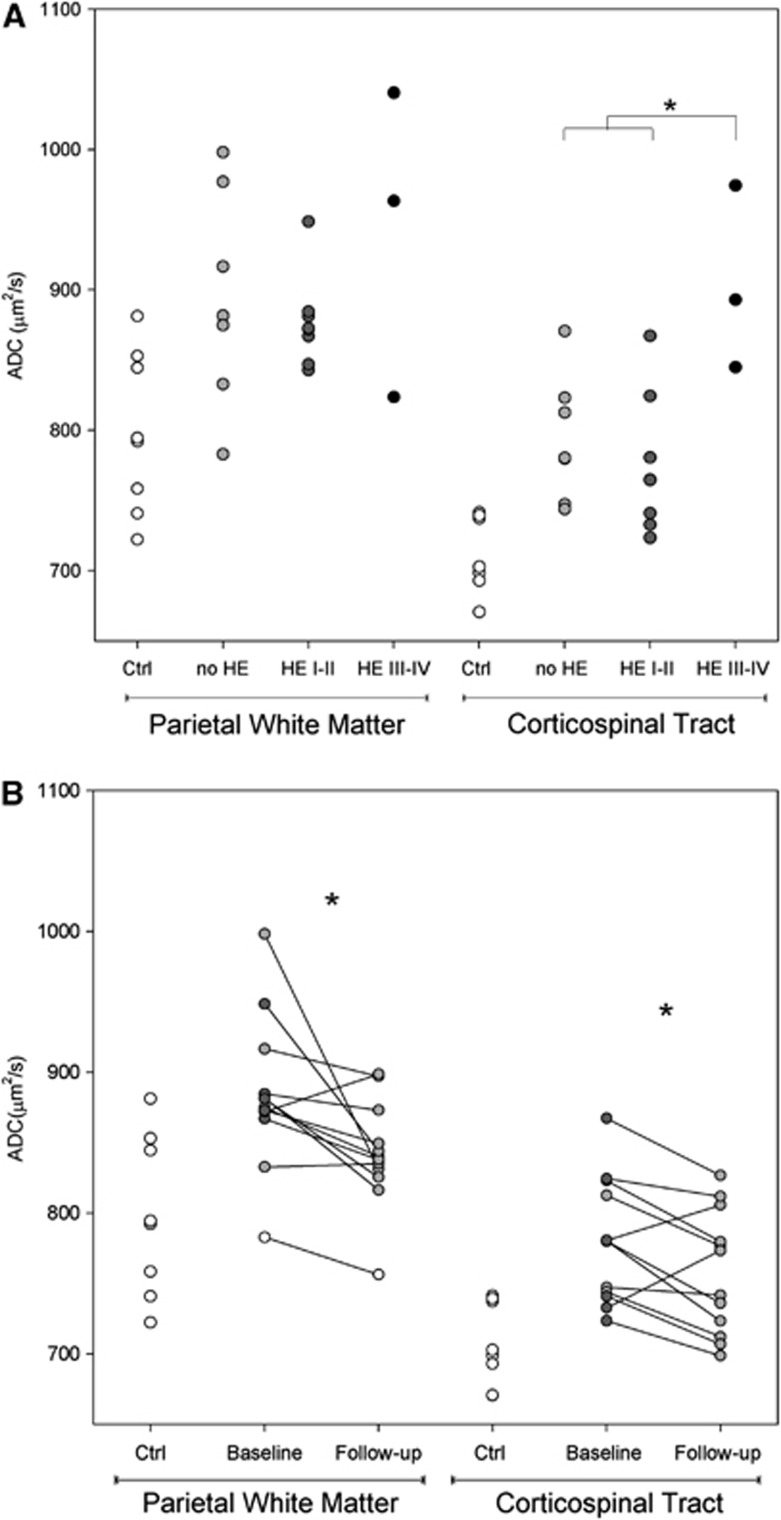
Figure 3.
(A) Apparent diffusion coefficient values (ADC, in μm2/s) in patients with different grades of hepatic encephalopathy (HE) (in gray, n=18) and controls (ctrl, in white, n=8) in two different regions. The mean of each group is marked by a dash. *P<0.050; (B) Follow-up of ADC values (in μm2/s) in patients with cirrhosis (n=12) in two brain regions. At first magnetic resonance (MR) assessment, values in patients without clinical HE are shown as gray circles, whereas patients with low-grade HE (grades I and II) are shown as dark gray circles. Healthy control values are shown to provide a reference for the normal range. *P<0.050.

