Figure 3.

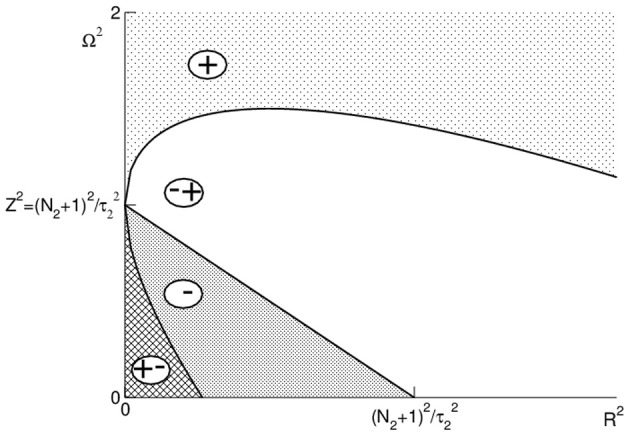
Illustration of the conditions (24) and (25). The regions are marked as follows: (+): dΩpeak/dΩ > 0, dΩpeak/dR > 0; (∓): dΩpeak/dΩ < 0, dΩpeak/dR > 0; (−): dΩpeak/dΩ < 0, dΩpeak/dR < 0; (±): dΩpeak/dΩ > 0, dΩpeak/dR < 0.

Illustration of the conditions (24) and (25). The regions are marked as follows: (+): dΩpeak/dΩ > 0, dΩpeak/dR > 0; (∓): dΩpeak/dΩ < 0, dΩpeak/dR > 0; (−): dΩpeak/dΩ < 0, dΩpeak/dR < 0; (±): dΩpeak/dΩ > 0, dΩpeak/dR < 0.