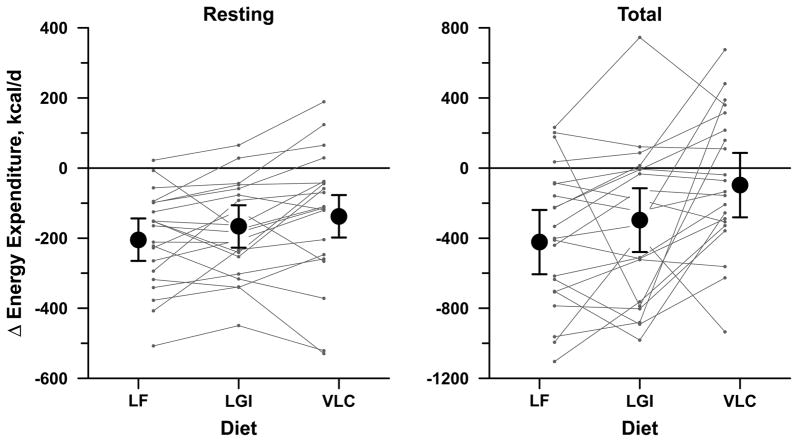
Figure 3. Changes in Energy Expenditure.
Resting energy expenditure (left) and total energy expenditure (right) during three test diets for weight-loss maintenance: low-fat (LF), low-glycemic index (LGI), and very low carbohydrate (VLC). Each symbol with error bars indicates mean change from a common baseline period preceding weight loss, with 95% confidence interval, obtained from analysis of cross-over experiment and adjusted for sex, age, order of diets, baseline weight, and mean weight during the 4-wk diet period. Connected lines indicate individual outcomes for the 21 subjects. Both resting and total energy expenditure showed a significant linear trend in mean change from LF to LGI to VLC, P< 0.01.

