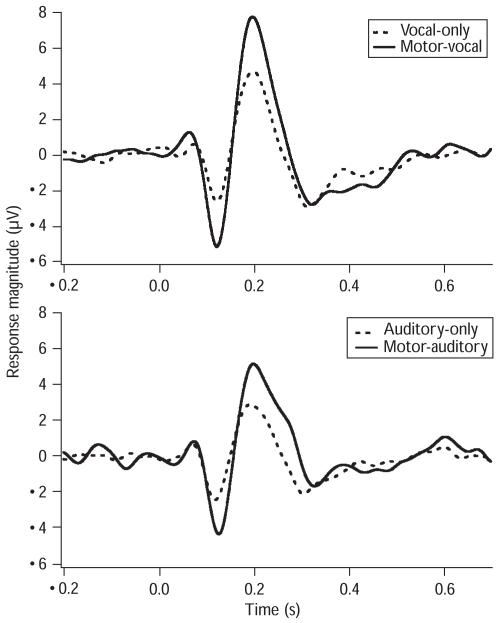
Fig. 1.
Auditory event-related potential waveforms (Cz) averaged over all participants across the conditions. The solid line denotes the auditory responses for the motor-vocal task and the motor-auditory task, and the dashed line for the vocal-only and the auditory-only tasks. Zero at horizontal axis represents where the pitch perturbations begin.

