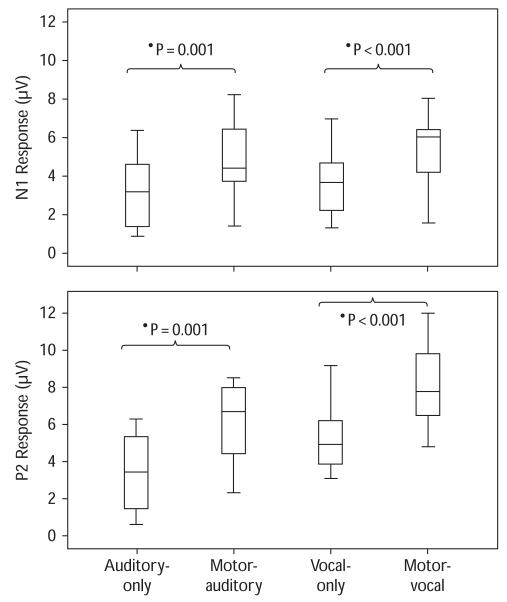
Fig. 2.
Box plots of N1 (top) and P2 (bottom) response magnitudes across all the tasks. Box plot definitions: middle line is median, top and bottom of boxes are 75th and 25th percentiles, whiskers extend to limits of main body of data defined as high hinge + 1.5 (high hinge – low hinge) and low hinge −1.5 (high hinge – low hinge).

