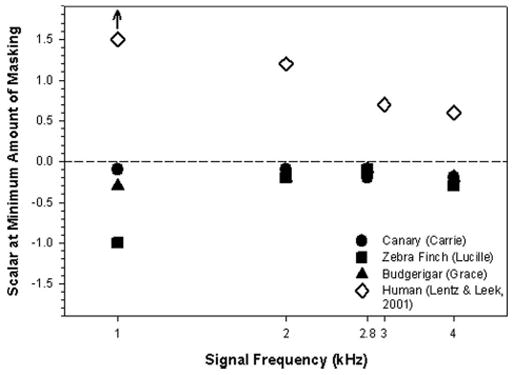
FIG. 6.

Scalar values corresponding to the harmonic complexes that produced the minimum amount of masking for different frequencies in a zebra finch, a canary, and a budgerigar are compared to values reported in humans by Lentz and Leek (2001). The arrow above the data point for humans at 1.0 kHz indicates that the true masker producing the minimum amount of masking was probably greater than those reported.
