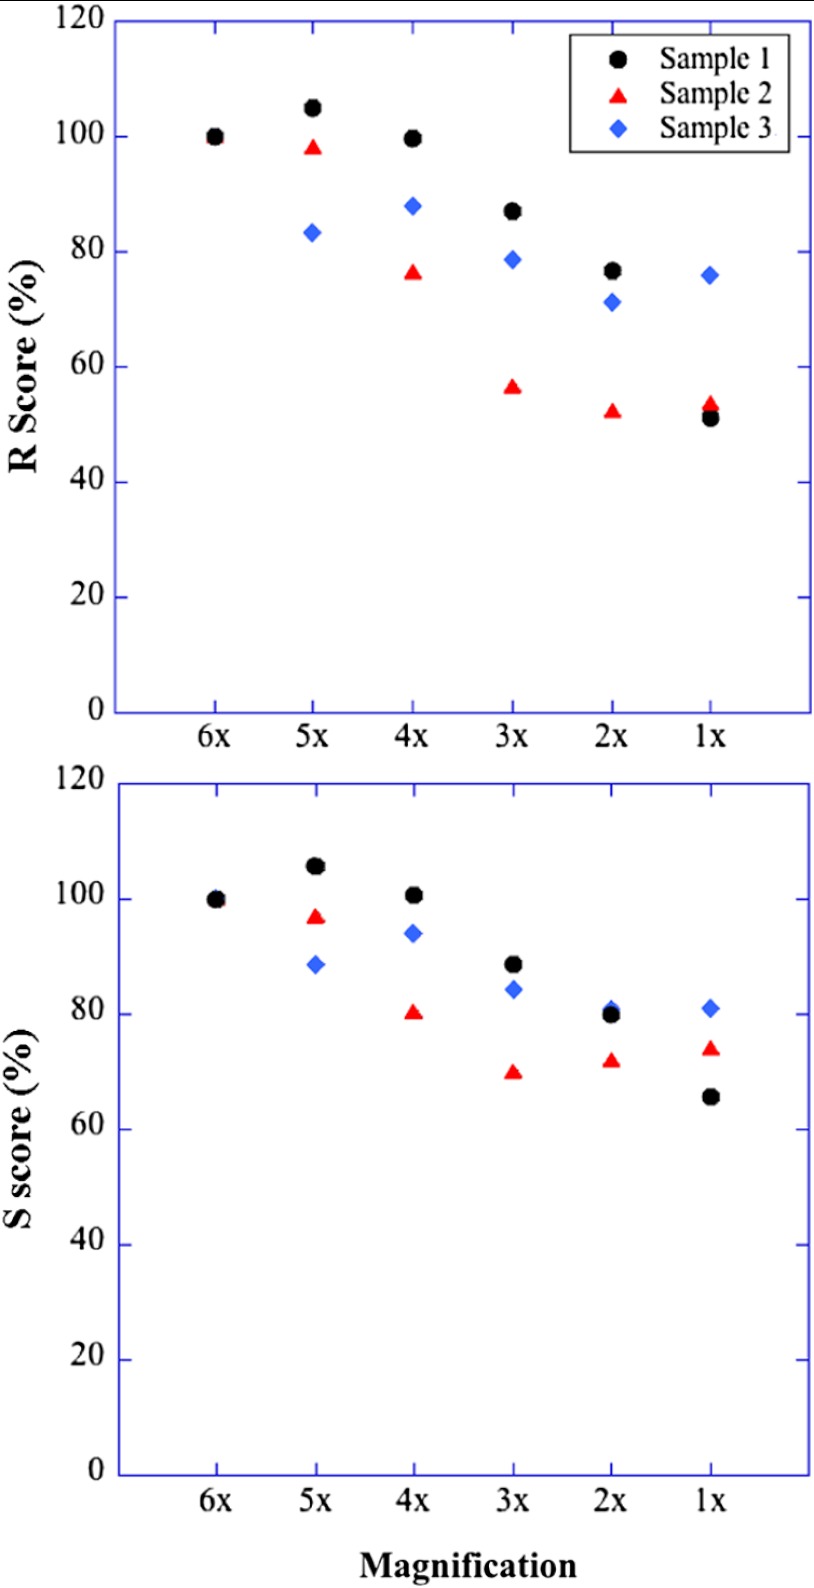
Fig. 6.
and are affected by large magnification changes. Three samples with different muscle condition were imaged. To assess the effect of magnification, the same area was imaged with one objective lens () and six different zoom values from 1 to 6. The plots show the scores expressed in %, with the magnification results taken as 100%. and decrease gradually as a function of magnification. The changes vary among different samples and are stronger between and (26% average decrease for ; 19% for ). The results are also presented in Table 2.

