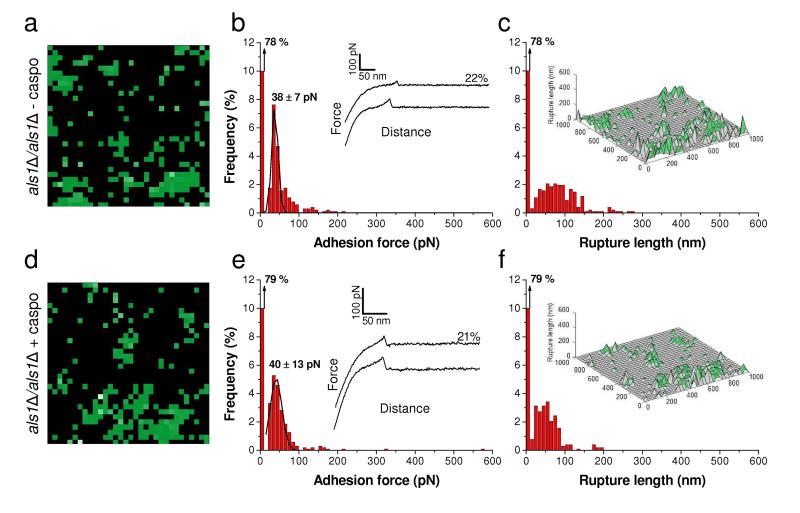
Fig. 6. Control experiment using an als1Δ/als1Δ mutant strain.
(a, d) Adhesion force maps (1 μm × 1 μm, color scale: 350 pN) recorded in buffer with a peptide-tip on als1Δ/als1Δ C. albicans cells grown without (a) or with (d) caspofungin (50 ng ml-1). (b, e) Corresponding adhesion force histograms (n = 1024) together with representative force curves. (c, f) Histograms of rupture distances (n = 1024), and 3-D reconstructed polymer maps (false colors, adhesion forces in green). Similar data were obtained in several independent experiments using different tip preparations and cell cultures.

