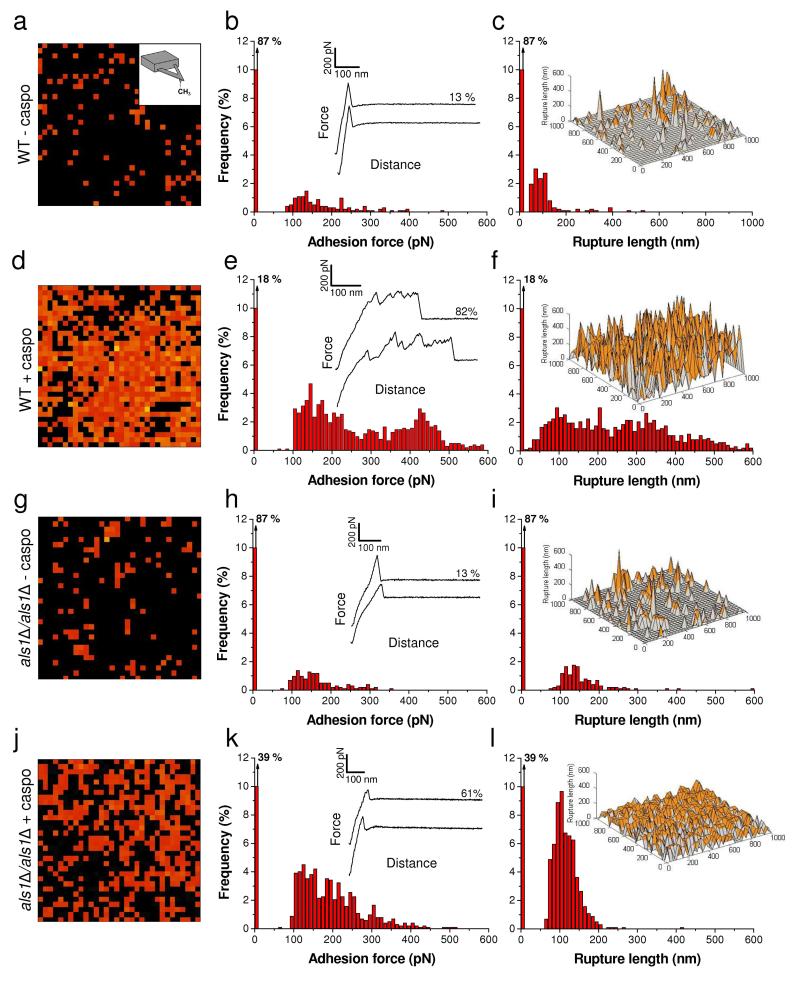
Fig. 7. Caspofungin increases cell surface hydrophobicity.
(a, d, g, j) Adhesion force maps (1 μm × 1 μm, color scale: 1000 pN) recorded in buffer on C. albicans WT cells (a, d) or als1Δ/als1Δ mutant cells (g, j), grown without (a, g) or with (d, j) caspofungin (50 ng ml−1) using hydrophobic tips. (b, e, h, k) Corresponding adhesion force histograms (n = 1024) together with representative force curves. (c, f, I, l) Histograms of rupture distances (n = 1024), and 3-D reconstructed hydrophobicity maps (false colors, adhesion forces in orange). Similar data were obtained in several independent experiments using different tip preparations and cell cultures.

