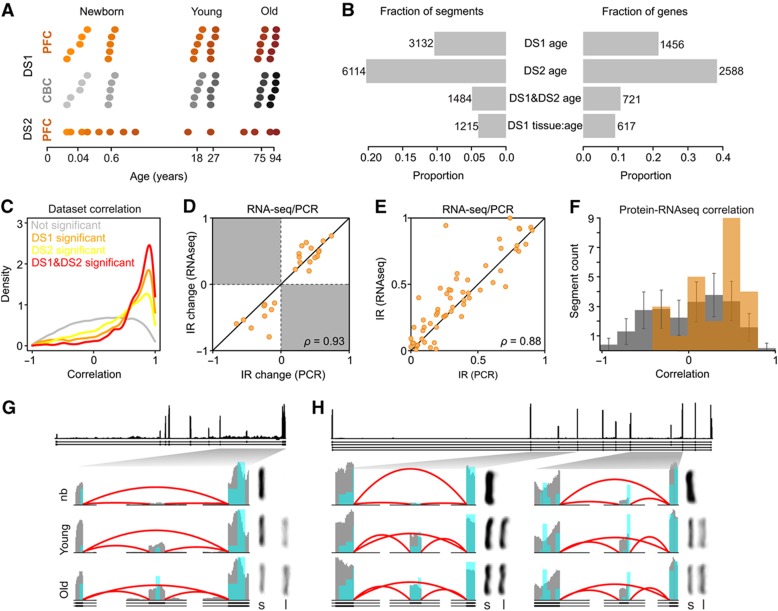
Figure 1.
Age-related splicing changes in the human brain. (A) Sample age distribution in PFC (orange) and CBC (gray). Each dot represents an individual; the darker shades of color represent older age. In DS1, five individuals of similar age were combined in each sample, resulting in six PFC- and six CBC-pooled samples with the average ages marked on the horizontal axis. (B) Fraction of genes (right) and segments (left) showing significant age-related splicing changes in DS1 (DS1 age), DS2 (DS2 age), and in both data sets (DS1 and DS2), as well as genes showing significantly different age-related changes in brain regions in DS1 (DS1 tissue:age). (C) Correlation of age-related splicing changes between DS1 and DS2. Shown are the distributions of the Pearson correlation coefficients for non-age-related segments (gray, N=22 360); segments significant only in DS2 (yellow, N=4630); segments significant only in DS1 (orange, N=1648); and segments significant in both data sets (red, N=1484). In all cases, only segments with sufficient coverage in both data sets were used. (D) Correlation of inclusion ratio changes with age measured by RT–PCR (horizontal axis) and RNA-seq (vertical axis). (E) Correlation of inclusion ratio estimates measured by RT–PCR (horizontal axis) and RNA-seq (vertical axis). (F) Correlation of age-related splicing changes measured at the transcript (RNA-seq) and protein (mass spectrometry) levels. Shown are the distributions of the Pearson correlation coefficients for the actual observations (orange) and 10 000 random permutations (gray). The difference between the means of observed and permutation distributions was significant (q=0.0004). At the individual segment level, 4 of 24 segments showed marginally significant correlations (Pearson correlation test, BH-corrected FDR<0.1). (G and H) Examples of age-related splicing changes in PFC for PALM (G) and MART (H) gene transcripts. Shown are: (top) RNA coverage (by all samples from DS1) and gene annotation (Ensembl, v57); (bottom) RNA (gray) and protein (blue) coverage and annotation of zoomed gene regions in newborns (nb), young and old individuals (an average of two pooled samples with similar age). The height of the red lines represents the RNA coverage of splice junctions. The PCR results showing relative abundance of the short (S) and long (L) isoforms for the depicted junctions are displayed to the right of the corresponding coverage plot.

