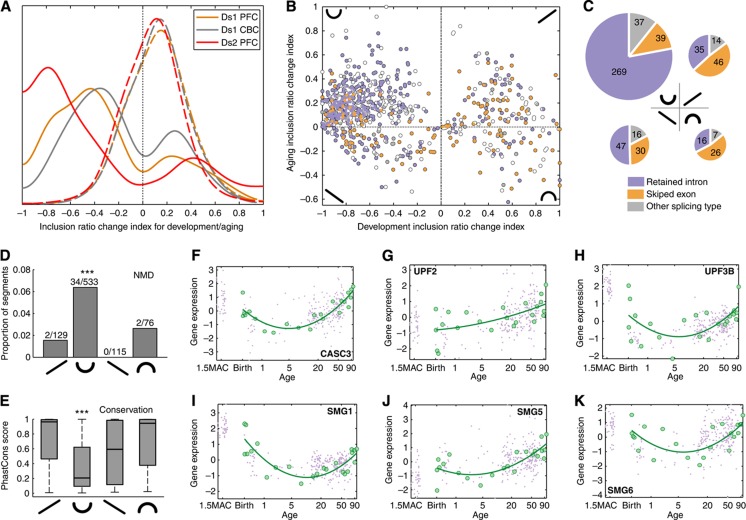
Figure 2.
Splicing changes in development and aging. (A) Distribution of the inclusion ratio change index for development (solid line) and aging (dash line) for 1484 age-related segments. The negative index represents the inclusion ratio decrease with age, positive index, the inclusion ratio increase. The colors represent RNA-seq data sets analyzed: yellow—DS1/PFC, gray—DS1/CBC, and red—DS2/PFC. (B) Scatter plot of the inclusion ratio change showing different splice types: violet—skipped exons, yellow—retained introns, gray and white—complex and mixed splice types respectively. Four quadrants of the plot correspond to four patterns of inclusion ratio change with age: down–up, up–up, up–down and down–down. Inclusion ratio change is plotted for the 853 segments showing significant splicing changes with age in both data sets and showing consistent direction of age-related splicing change between data sets in development, as well as in aging. (C) Schematic representation of segment numbers (represented by the size of the pie diagrams) and splicing type fractions (represented by colors) in the four inclusion ratio change patterns shown in panel B. (D) Fractions of NMD segments in the four inclusion ratio change patterns. Numbers on top of the bars show the number of NMD segments and the total number of segments in each pattern. Asterisks indicate significant enrichment of NMD segments in the ‘down–up’ pattern (one-sided Fisher’s exact test, P=0.0002) (E) Distribution of the phastCons scores of segments in the four inclusion ratio change patterns. Asterisks indicate significantly low conservation of segments in the ‘down–up’ pattern (one-sided Wilcoxon test, P<0.0001). (F–K) Gene expression of NMD-related genes, CASC3, UPF2, UPF3B, SMG1, SMG5, and SMG6 in the human PFC. Gene expression was estimated based on published data from (Liu et al, 2012) (green) and (Colantuoni et al, 2011) (violet). Expression intensities for each gene were normalized to mean=0 and s.d.=1. Age scale is log2-transformed, ages are shown in years, MAC stands for ‘months after conception’.

