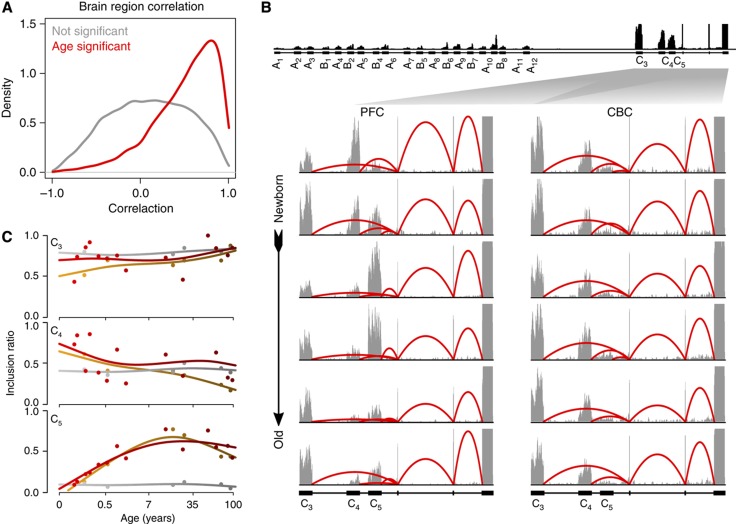
Figure 4.
Age-related splicing changes in PFC and CBC. (A) Correlation of age-related splicing changes between the PFC and CBC in DS1. Shown are distributions of the Pearson correlation coefficients for 24 458 segments with sufficient coverage in both data sets but not significant in DS1 (gray), and for 3132 segments showing significant age-related splicing changes in DS1 (red). (B) Age-related splicing changes in the protocadherin gamma transcript in the human PFC and CBC. RNA-seq coverage in all 12 DS1 samples is shown. (C) Inclusion ratio profiles of the protocadherin gamma C3-C5 exons. The colors represent the RNA-seq data sets analyzed: yellow—DS1/PFC, gray—DS1/CBC, and red—DS2/PFC. The points represent the inclusion ratios and the lines represent the cubic spline curves fitted with three degrees of freedom.

