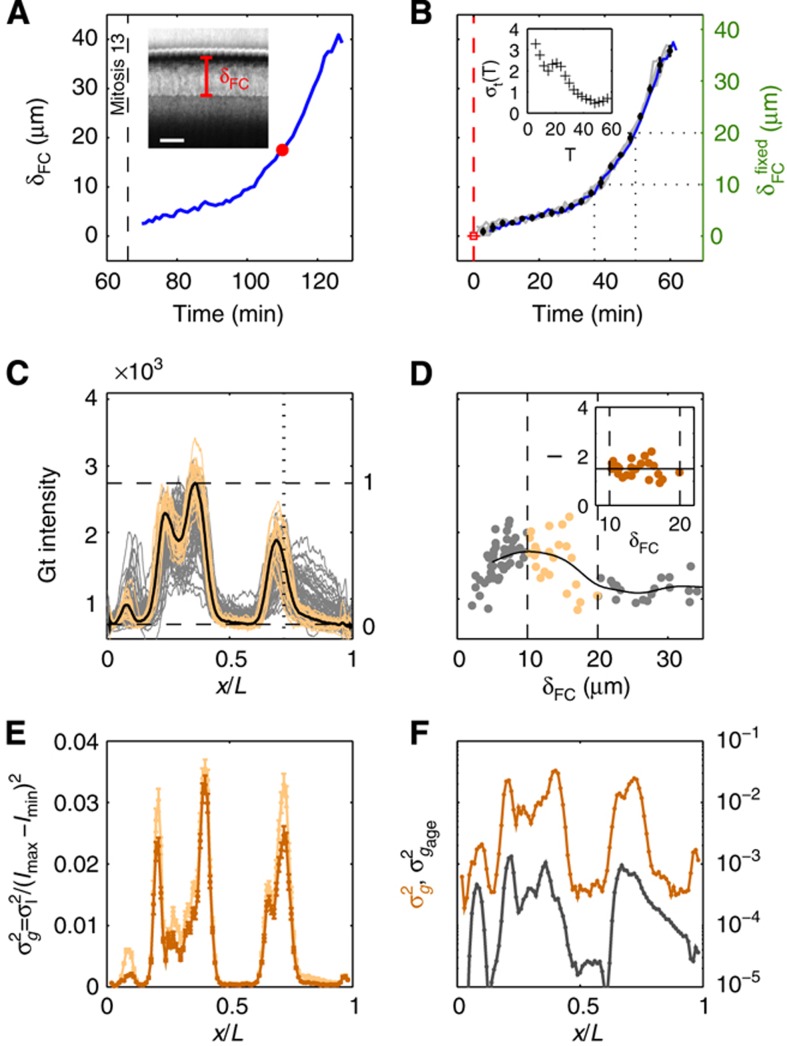
Figure 2.
Staging of gene expression profiles in fixed embryos with minute precision. (A) Depth of FC (δFC) during blastoderm cellularization measured along the dorsal side of a live-imaged wild-type embryo during n.c. 14. Dashed line corresponds to our estimate of mitosis 13. Inset shows a bright field microscopy image of a fraction (40–50%EL) of the dorsal side of the embryo at a time point indicated by red dot; scale bar 10 μm. δFC, defined as the distance between the FC and the edge of the embryo, was measured as indicated by red bar. (B) Invagination of the membrane for eight embryos (gray lines) with binned means and s.d.’s in black. The mean of the onsets of n.c. 14 is indicated as a red dashed line and their s.d. is represented by the error bar of the red square. The profile in A is shown in blue here. Scale on the right shows the adjusted length measured in fixed embryos (on average 5% EL shrinkage w.r.t. living embryos). Inset shows the measurement error of the embryo age estimation  as a function of time. (C) Raw dorsal Gt intensity profiles of 80 embryos imaged in their midsagittal plane (DV orientation) with T=0–60 min (gray) and a subset of 23 embryos with T=37–49 min (light orange). The mean intensity profile of the 23 embryos is shown in black and its minimum and maximum in the 10–90% EL region are shown as dashed lines (defining the minimum (0) and maximum (1) gene expression levels g, respectively). (D) Intensity measured at position x/L=0.72 (vertical gray dotted line in C) as a function of δFC, each point representing a different embryo. The 23 points of the 10–20 μm batch are plotted in light orange. The black line represents a nearest neighbor averaging with a Gaussian filter (σ=5 μm). Inset shows detrended light orange data points with weighted average subtracted, i.e., time-corrected. (E) Variance of Gt gene expression levels σg2 computed for the same 23 embryos shown in panel C before (light orange) and after (dark orange) time correction, respectively. Error bars obtained by bootstrapping; σI2 is the variance of the raw intensities (across orange profiles in C). (F) Estimation of residual variance in age determination
  (gray) due to measurement uncertainty
  after profile time correction (gray line); for comparison, in dark orange the variance σg2 of the time-corrected normalized profiles. For a similar analysis of the other gap genes see Supplementary Figure 2.

