
Figure 3.

Quantification of imaging noise and antibody nonspecificities. (A) Schematic representation of a simultaneous staining process by two distinct primary anti-Hb antibodies and their respective secondary antibodies conjugated with differently colored dyes. The systematic error σI in nuclear intensity measured in each optical channel comes from imaging noise (mainly owing to photon counting and laser intensity fluctuations) as well as the random binding processes for primary and secondary antibodies. (B) Scatter plot of the nuclear intensities from two channels with different anti-Hb antibodies and Alexa-conjugated dyes (anti-rat(488) and anti-guinea pig(546)). As the two channels are detected separately and have different primary and secondary antibodies, the scatter of gray dots results from the combined errors owing to imaging and staining (primary and secondary). Two dashed lines define the minimum (red dot) and the maximum gene expression levels, Imin and Imax, respectively. Inset shows dependence of measurement noise σI (s.d. of the distance of the points to the diagonal divided by  ) as a function of the mean intensity I, computed over 40 equally spaced bins along the whole intensity range (only data points with five or more nuclei are shown). S.d. of zero expression level region shown as a red dot. (C) Rescaled measurement noise contribution from imaging and staining
 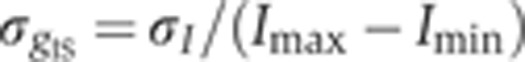 (computed from the data shown in inset of panel B) as a function of the gene expression level g. Red dot shows the background noise, and two dashed lines represent the 1 and 4% measurement noise levels, respectively. Error bars computed by bootstrapping.