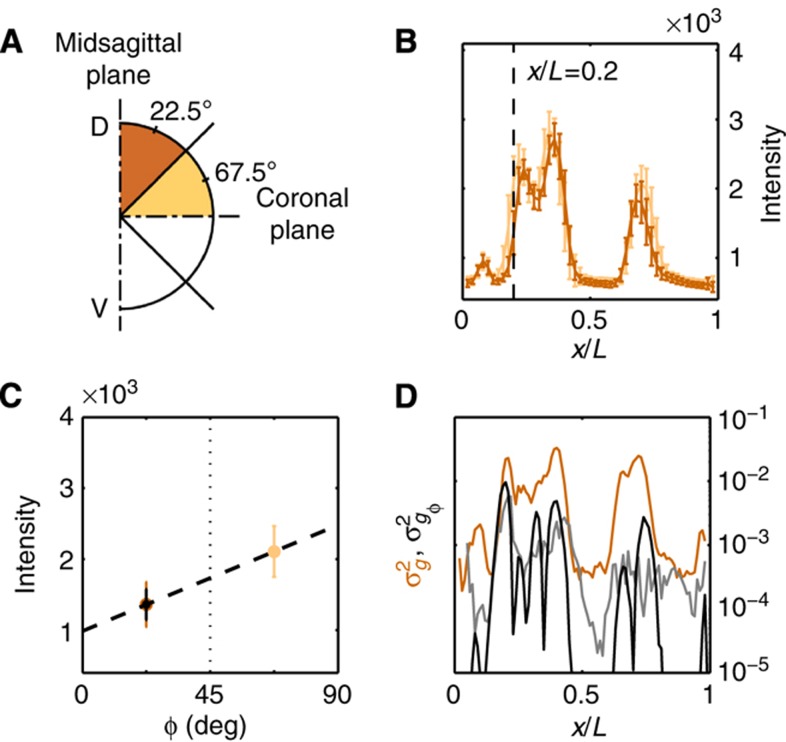
Figure 4.
Contribution of azimuthal embryo orientation uncertainty to Gt gene expression profile reproducibility. (A) Schematic representation of the absolute azimuthal angle distribution of the embryos depending on their imaging plane. (B) Mean and s.d. of dorsal time-corrected Gt intensity profiles of embryos whose imaging plane is closer to the midsagittal plane (dark orange, DV orientation, 23 samples, δFC=10–20 μm) or closer to the coronal plane (light orange, LR orientation, 23 samples, δFC=10–20 μm). (C) Linear estimate of the DV dependence of raw dorsal Gt intensity at the fractional EL x/L=0.2. The systematic error in intensity owing to embryo orientation uncertainty of the dark brown profiles σI (shown in black) is estimated by propagating the uncertainty on the azimuthal angle σφ (uniform distribution ϕ=0–45°), σI=σφ·dI/dφ, where dI/dϕ is the slope of the dashed line (see text). (D) Variance of Gt gene expression profiles due to embryo orientation uncertainty (in black), computed as  ; total variance of gene expression profiles of the time-corrected dorsal profiles is shown in dark orange for comparison, gray line shows an estimation of the variance induced by the embryo orientation uncertainty by the alternative method of Supplementary Figure 4.

