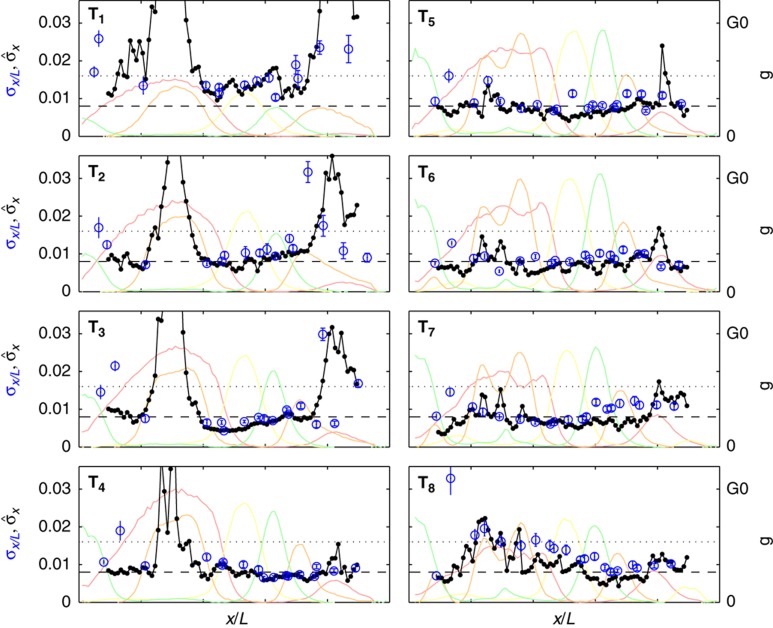
Figure 7.
Developmental progression of gap gene expression profile reproducibility. Position dependence of the reproducibility of the markers, computed as the s.d. of their positions across embryos σx/L for eight time windows covering 90% of n.c. 14 (T1=10–25 min, T2=26–29 min, T3=30–33 min, T4=34–36 min, T5=37–40 min, T6=41–45 min, T7=46–50 min, and T8=51–55 min) are shown as blue circles. The positional error  obtained by simultaneously decoding all four gap genes (four-dimensional extension of Supplementary Figure 7) is shown in black for 100 AP positions. For reference, the mean gap gene profiles are shown in the background, color coded as above. Profiles have been scaled such that the maximum level of gene expression of their mean over the eight time windows is G0. The internuclear distance and half-internuclear distances are shown as dotted and dashed lines, respectively.

