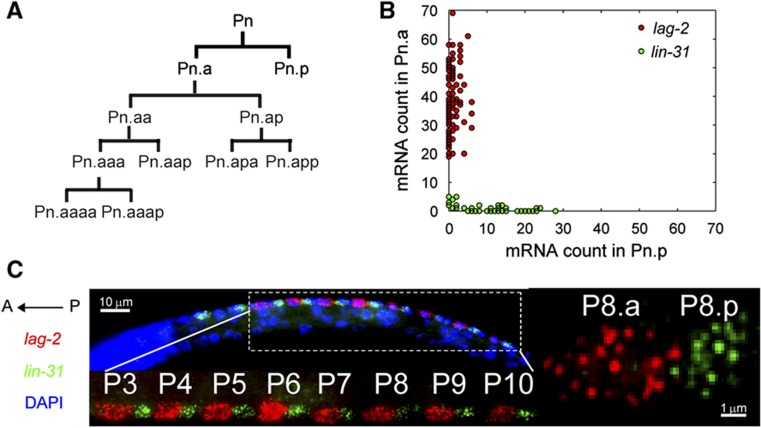
Figure 1.
Identification of Pn.a and Pn.p expression markers. (A) Lineage diagram of P cells. P cells divide to form Pn.a and Pn.p. Pn.a divides to give rise to five different neurons in L1. Pn.p does not divide till the L3 stage. (B) Plot of lag-2 (red) and lin-31 (green) mRNA in Pn.p versus Pn.a. (C) (Top, left) Image of L1 larva after in situ hybridization with lag-2 (red) and lin-31 (green) probes. Dapi is shown in blue. (Top, bottom) Maximum projection image of multiple z-stacks that shows lag-2 (red) and lin-31 (green) expression in Pn.a and Pn.p from the P3–P10 lineages. (Right) Zoom in image of a single stack showing individual lag-2 and lin-31 transcripts in P8.a and P8.p.

