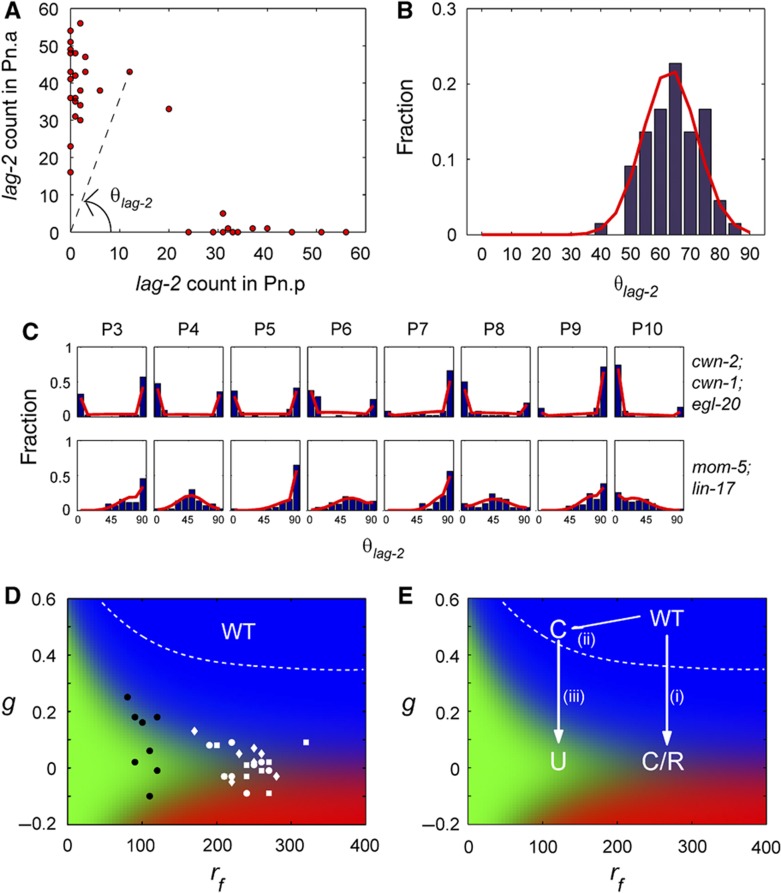
Figure 5.
Fitting of ligands and receptors mutants distributions. (A) Plot of lag-2 mRNA counts in P3.p versus P3.a in egl-20; cwn-1; cwn-2 strain and illustration of how θlag-2 is calculated. (B) Histograms for θlag-2 (blue) and maximum likelihood fits (red) for mom-4; lit-1 strain grown at 25°C for 9 h. (C) Histograms for θlag-2 (blue) and maximum likelihood fits (red) for P3–P10 in egl-20; cwn-1; cwn-2 and mom-5; lin-17 strains. (D) Fit parameter, g and rf obtained using maximum likelihood for triple-ligand mutant (egl-20; cwn-1; cwn-2 strain) (white) and receptor mutant (mom-5; lin-17 strain) (black). White dotted line shows the region of parameter space giving rise to above 99.9% correct divisions. Although the parameters of WT P cells cannot be determined exactly as many combinations of parameters can give rise to 100% correct polarity, the parameters of WT P cells must lie above the white dotted line. Hence, values of g obtained for both ligands and receptors mutants are lower than that of WT P cells. (E) Abstraction of parameters’ movement in phase space as a result of mutations. (i) Decreasing ligands in WT P cells leads to reduction of g and converts correct polarity into the coexistence of correct and reverse polarity observed in the triple-ligand mutant. (magneta) (ii) Decreasing receptors slightly will lead to reduction of rf and cells that still polarize correctly if the parameters lie within the region of correct division (white dotted line). (iii) Decreasing ligands in strains with reduced rf would lead to loss of polarity.

