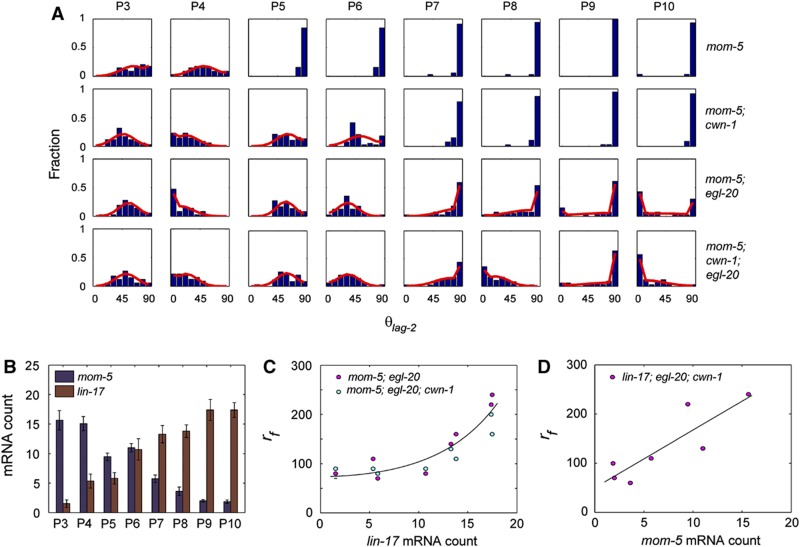
Figure 6.
Effects of reducing ligand in mom-5 background and correlation between receptor level and rf. (A) Histograms of θlag-2 (blue) and maximum likelihood fits (red) for P3–P10 in mom-5 single receptor mutant and mom-5; cwn-1, mom-5; egl-20 and mom-5; cwn-1; egl-20 compound mutants. (B) mom-5 (blue) and lin-17 (red) mRNA counts in P3–P10. (C) Plot of average lin-17 mRNA versus rf for P3–P10 in mom-5; egl-20 and mom-5; cwn-1; egl-20 strains. Exponential fit is shown in black. (D) Plot of average mom-5 mRNA versus rf for P3–P10 in lin-17; cwn-1; egl-20 strains. Linear fit is shown in black.

