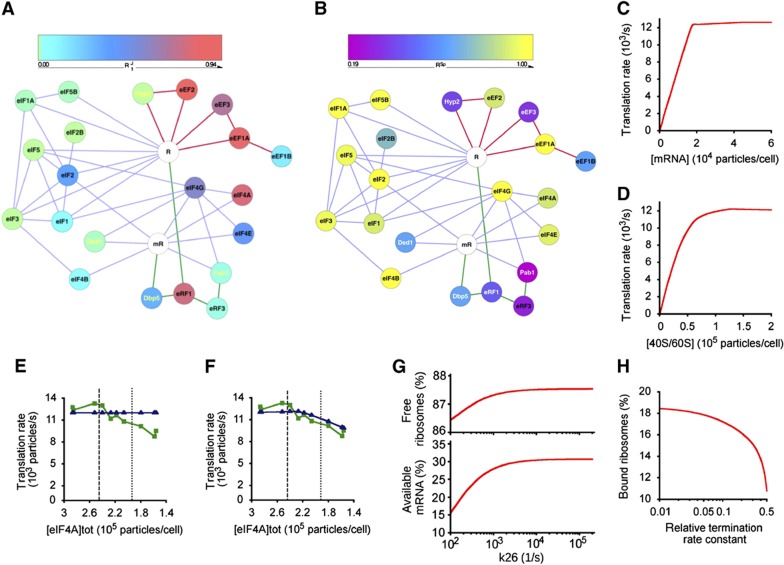
Figure 2.
Control maps and the digital translation model. (A) R1J graph featuring the respective translation factors as nodes (colour-coded according to R1J value) and the confirmed physical/functional interactions as edges (lines colour-coded for initiation (lilac), elongation (red), and termination (green)). The mRNA (mR) and ribosome (R) are represented in white. (B) Equivalent graph for RSp values. (C–H) Predictions of the in silico translation model described in this paper. The model predicts the protein synthesis rate versus intracellular mRNA abundance (C) and versus ribosome content per cell (D) (compare Figure 4B). The digital model calculated the response profile (blue) assuming an obligatory eIF4A:eIF4B intermediate (E), and where eIF4A can function independently of this complex (F). The green line shows the averaged experimental data points (as in Figure 1). Vertical dashed and dotted lines indicate the 100 and 80% points on the eIF4A concentration axis. Changing the elongation rate (magnitude of the rate constant for reaction 26 in Supplementary Figure 1D) affects the intracellular populations of ribosomes and mRNA available for initiation (G). Changing the termination rate (the ratio of the actual termination rate constant versus the standard rate constant used in the model) affects the populations of ribosomal subunits available for initiation (H).

