Figure 3.

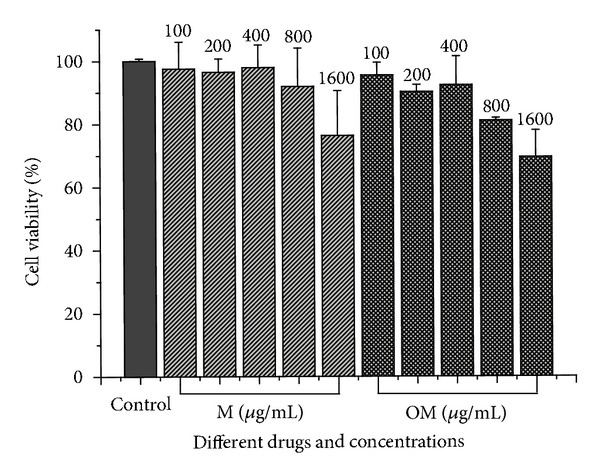
The cytotoxicity of matrine and oxymatrine on HepG2 2.2.15 cells was evaluated by an MTT assay. The cell viability expressed as a percentage of control. The data are presented as the mean ± S.D. (n = 3).

The cytotoxicity of matrine and oxymatrine on HepG2 2.2.15 cells was evaluated by an MTT assay. The cell viability expressed as a percentage of control. The data are presented as the mean ± S.D. (n = 3).