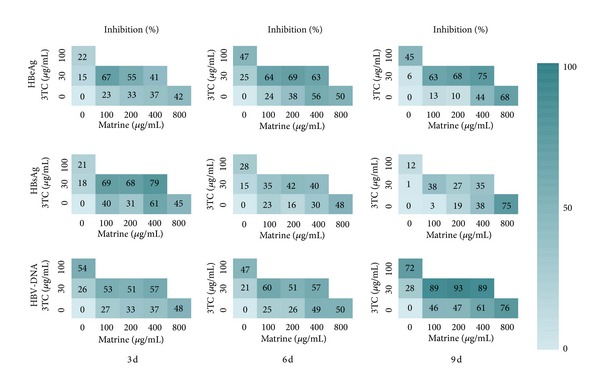
Figure 4.

The anti-HBV activity matrices of 3TC, matrine, and their combinations in different concentrations. The average inhibitory effects (%, n = 3) on the secretion of HBsAg, HBeAg, and HBV-DNA are labeled in the squares for each pair of combinations. The colors of the squares visually indicate the inhibitory level.
