
Figure 3.
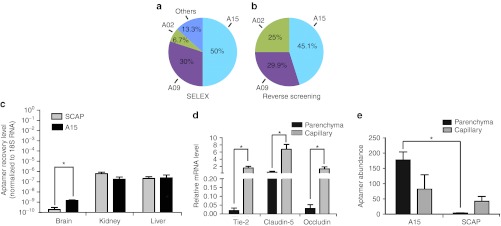
The A15 aptamer shows enhanced specificity to brain. (a) Data represent the percentage of the denoted aptamer present after sequencing of clones from SELEX. (b) Data represents the percentage of the denoted aptamer found in the reverse screening assay. For this, equal amounts of selected RNA motifs (A02, A09 or A15, see Table 1) and scrambled A15 (SCAP) were mixed, and injected into mice. RNA was extracted from the brain, reverse transcribed, cloned, and colonies were sequenced. The frequency of the sequences representing each aptamer is shown. (c) Equal amounts of aptamers (SCAP and A15) were peripherally injected in mice (n = 3–4) and after 4 hours, total RNA was isolated. Aptamer quantitation in brain, kidney, and liver was done using one-step qRT-PCR (5 µg of DNase-treated input RNA) by including 18S RNA as loading control. (d) Quantification of A15 aptamer in capillary versus parenchymal tissues after peripheral injection. Mouse brain capillaries were clarified from brain parenchymal fractions by density centrifugation, and the purity of the capillary fraction was evaluated by assessing the endothelial cell-specific markers Tie-2, Claudin-5, and Occludin. mRNA levels were normalized to GAPDH. Data are expressed as means ± SD (*P < 0.05, Student's t-test; n = 3). (e) qRT-PCR to evaluate aptamer abundance in the indicated fractions. Data are presented as means ± SD using ANOVA and Bonferroni post hoc for significance (*P < 0.05; n = 3 mice per group). ANOVA, analysis of variance; GAPDH, glyceraldehyde 3-phosphate dehydrogenase; qRT-PCR, quantitative reverse transcription-PCR; SELEX, Systematic Evolution of Ligands by EXponential enrichment.