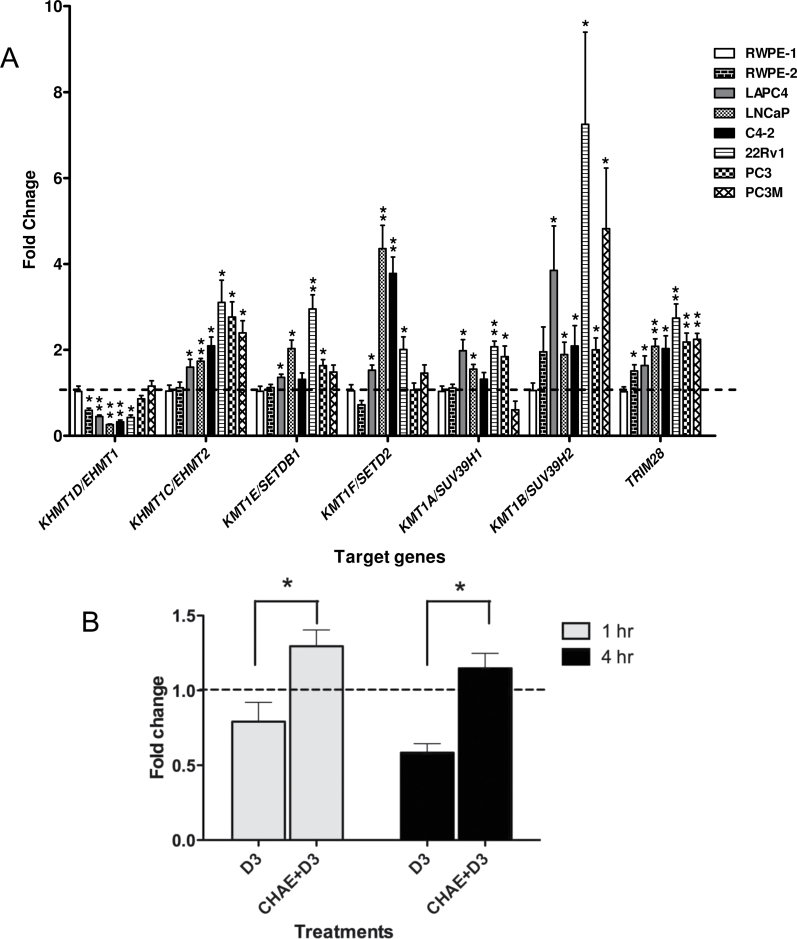
Fig. 4.
Histone methyltransferases expression in prostate cell lines. (A) Differences in expression levels of the indicated histone methyltrasnferase, compared with 18S expression, measured by TaqMan Q-RT–PCR in the indicated prostate cancer cells compared with RWPE-1 cells. Each data point represents the mean of three separate experiments amplified in triplicate wells ± standard error mean (*P < 0.05, **P < 0.01). (B) PC-3 cells were pretreated with chaetocin (200nM) or ethanol control for 24h then treated with either 1α,25(OH)2D3 or ethanol control for a further 1h & 4h and mRNA was extracted, and accumulation of CDKN1A (encodes p21(waf1/cip1)) was measured using TaqMan Q-RT–PCR. For 1α,25(OH)2D3 only treatment (no chaetocin pretreatment), expression levels were compared with ethanol control and presented as fold change. For chaetocin pretreatments cells, the fold change in CDKN1A in response to 1α,25(OH)2D3 was compared with ethanol control. Therefore, fold expression changes were calculated for 1α,25(OH)2D3 compared with ethanol control with no chaetocin pretreatment (D3) or 1α,25(OH)2D3 compared with ethanol with chaetocin pretreatment (CHAE+D3). Each data point represented the mean of biological and technical triplicates ±standard error mean.

