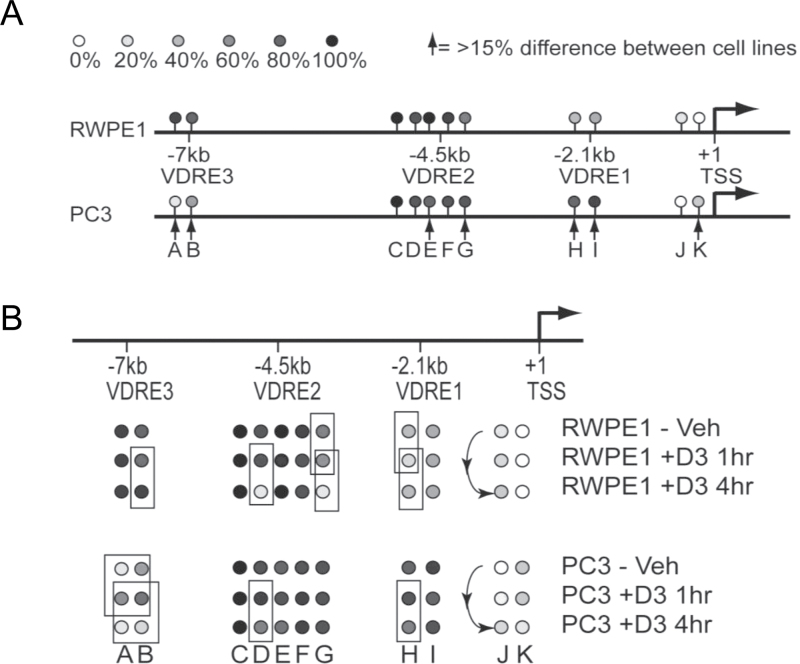
Fig. 5.
Altered DNA methylation patterns on the CDKN1A regulatory regions. RWPE-1 and PC-3 cells were treated with 1α,25(OH)2D3 (100nM) or ethanol control for indicated time points and DNA and RNA were extracted. DNA methylation was measured by quantitative bisulfite sequencing using MAQMA and the percentage of methylation at each CpG position is indicated by the gray scale shown at the top of the figure. (A) Comparison of basal methylation levels between RWPE-1 and PC-3 cells. Arrows indicate positions where there is a difference in percentage of methylation greater than 15%. (B) 1α,25(OH)2D3 induced changes in DNA methylation for both cell lines. Boxes indicate comparisons where the 1α,25(OH)2D3 treatment led to a change in percentage of methylation greater than 15%.

