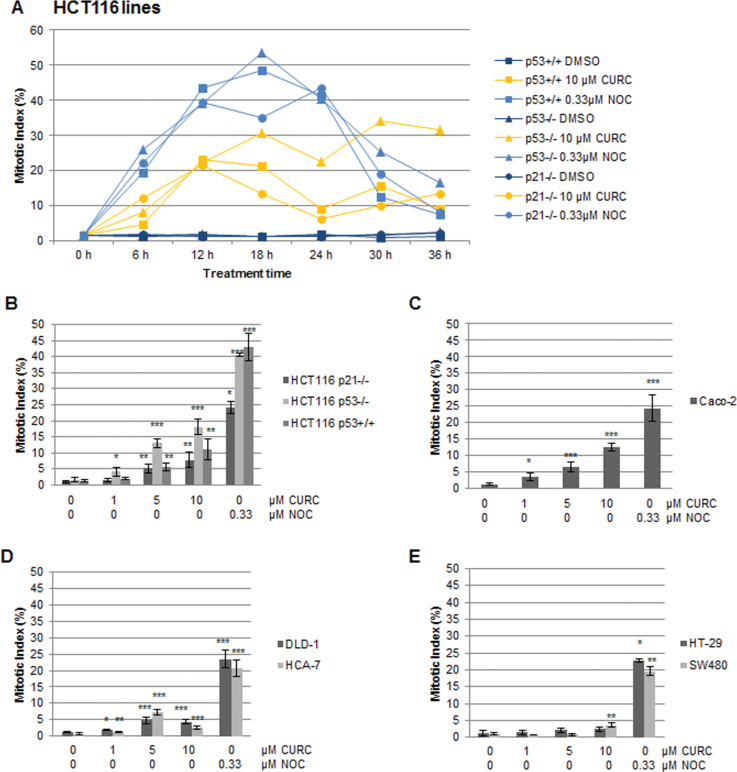
Fig. 2.
Curcumin-induced mitotic arrest in CRC cell lines. Cells treated as shown with curcumin or nocodazole were stained with anti-phospho-H3 antibodies and Hoescht and assessed by fluorescence microscopy. (A) Analysis of levels of mitotic arrest in HCT116 lines over a period of 36h. For each datapoint 1000+ cells were analysed (n = 1). (B–E) Dose response analysis of mitotic arrest following treatment for 12h in (B and D) MIN lines, and (C and E) CIN lines. At least 500 cells were scored per datapoint. n = at least 3 ±SD. *P < 0.05, **P < 0.01, ***P < 0.001 compared with the DMSO control.

