Fig. 5.
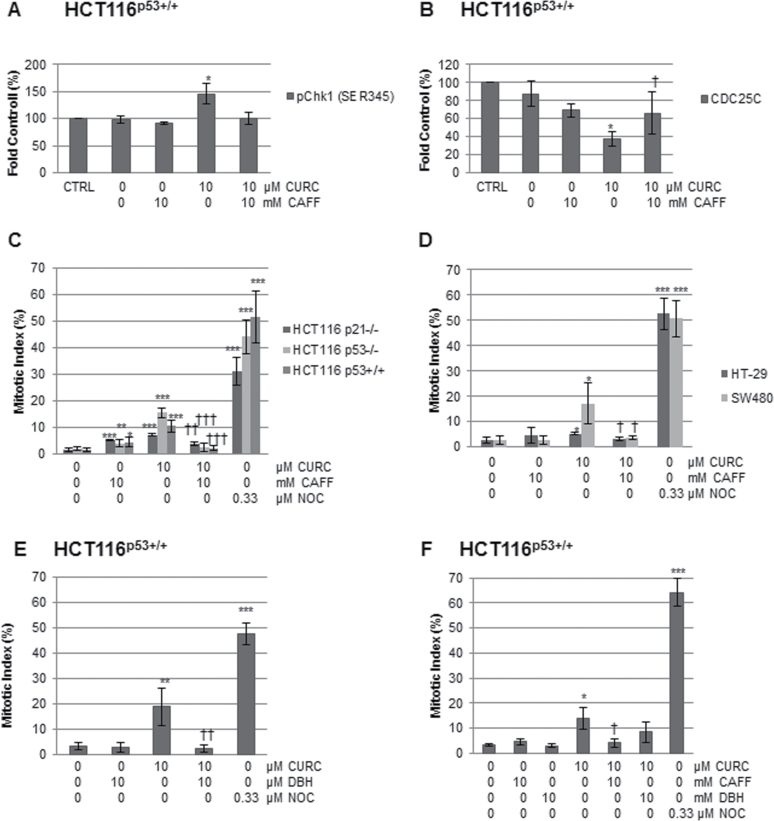
The effect of inhibitors on DNA damage signalling and mitotic arrest. Cell lysates, treated as indicated for 12h, were analysed by western blotting for (A) pChk1S345 (B) CDC25C and levels normalized to loading controls. *P < 0.05 and **P < 0.01 between DMSO and curcumin, following a two-tailed t-test assuming equal variance. Mean ± SD (n = 3). †P < 0.05 between cells treated with curcumin and those pre-treated with caffeine followed by curcumin. (C and D) Cells were pre-treated with caffeine for 1h then curcumin for 12h and assessed using fluorescence microscopy. At least 500 cells were scored per datapoint. n = at least 3 ±SD. *P < 0.05, **P < 0.01, ***P < 0.001 compared with the DMSO control, and †P < 0.05, ††P < 0.01, †††P < 0.001 in cells pre-treated with caffeine then curcumin compared with curcumin alone. (E) Cells were pre-treated with DBH for 1h followed by curcumin for 12h, and assessed as above. At least 100 cells were scored per datapoint. Mean (±SD) n = 3. **P < 0.01, ***P < 0.001 compared with DMSO control. ††P < 0.01 between curcumin alone and DBH plus curcumin. (F) Cells were pre-treated with DBH or caffeine for 1h, followed by curcumin for 12h and mitotic index assessed by flow cytometry using antibodies to phospho-histone H3. At least 10 000 cells were analysed per datapoint. Mean (±SD) of at least 3 independent experiments. *P < 0.05, ***P < 0.001 difference from the DMSO control. † indicates a significant difference (P < 0.05) between cells treated with curcumin alone and cells pre-treated with caffeine or DBH followed by curcumin.

