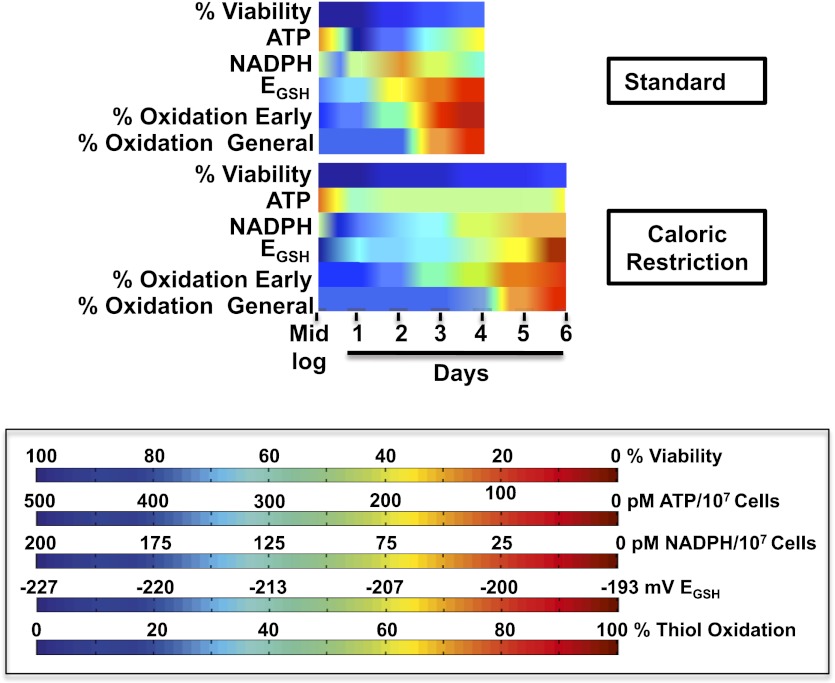
Figure 7. Timeline of redox events in chronologically aging yeast cells.
The graphs shown provide a comparative assessment of cell viability (based on data shown in Figure 1A), ATP levels (Figure 2B), NADPH levels (Figure 6B), EGSH measurements (Figure 6A), and thiol oxidation states of representative early (i.e., PYC2) and general targets (e.g., GapDH/TDH) (Table 1) during the chronological lifespan of yeast strain DBY746 under standard and caloric restriction conditions. A colored scale for each assessed parameter is provided.

