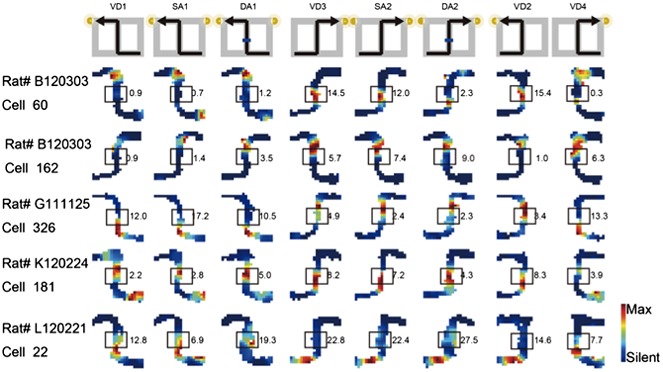
Author response image 3. Journey-dependent coding of a place-specific activity modulated with task-demand.

The rate maps for five CA1 pyramidal cells. The maps are averages for repeated sessions. Each row shows the data from one pyramidal cell. Note that different journeys in the same place resulted in place fields similar in locations, but different task-demands caused different firing intensities in those place fields. Boxes indicate the middle region of the central stem. The rate was coded on a color scale from blue (silent) to red (maximum rate). The pixels that were not sampled are white. The symbols above the map indicate the journey, task-demand, and illuminated light-cue. For each cell, the rate scale corresponds to the peak firing rate in Hz in that condition (indicated to the right of the rate maps).
