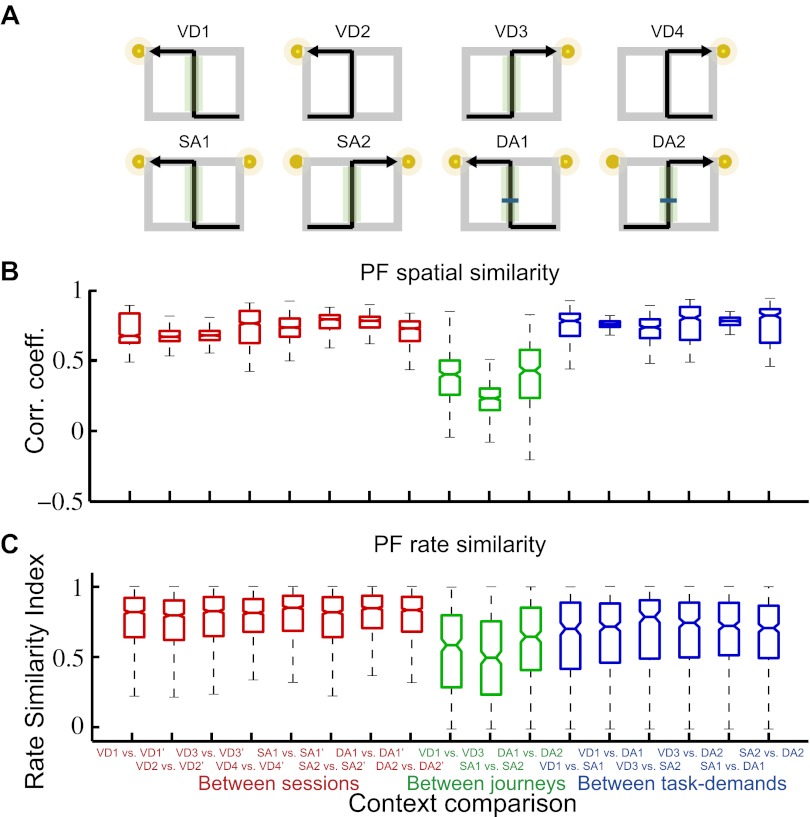
Figure 4. A quantitative assessment of the spatial and rate similarities between a pair of trial types.
(A) The similarities were measured between a pair of trial types (VD1, VD2, VD3, VD4, SA1, SA2, DA1, and DA2) or between repeated exposures to an identical trial type. Because the central stem of the maze was the common running route among the different journeys within a given subtask, the region of interest (ROI) was set at the region highlighted in the green shaded box. Box plots of the spatial (B) and rate (C) similarities between repeated exposures to an identical journey and task-demand (red), between different journeys within a given task-demand (green), and between different task-demands within a journey (blue) (median, first and third quartiles, minimum, and maximum indicated). Repeated exposures are marked with an apostrophe.

