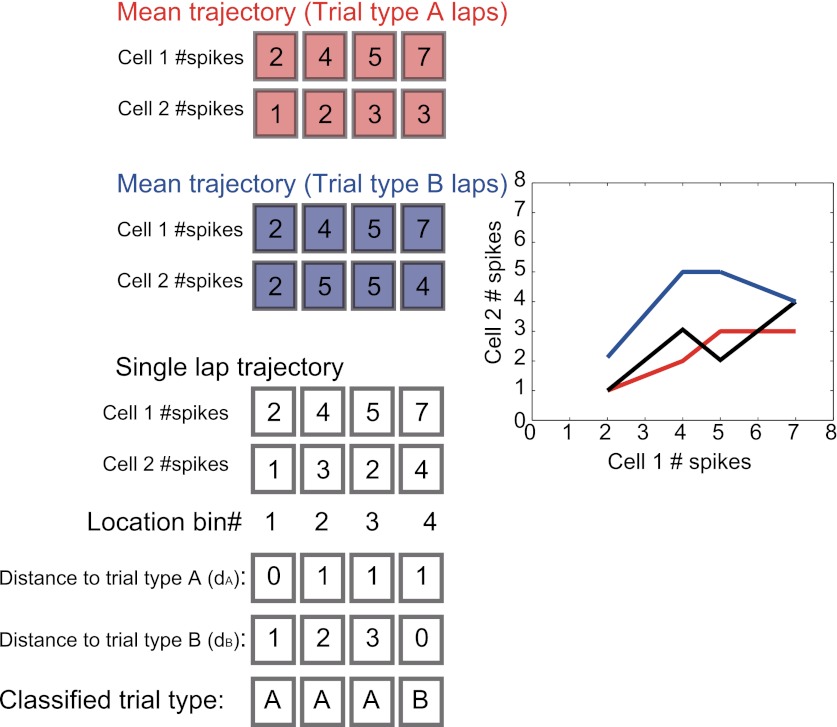
Figure 5. A schematic of a classification scheme based on the distances to the mean trajectories.
At each location, the Euclidian distance from the trajectory on a single lap (black) to the mean trial type trajectories (red and blue) was calculated (dA, dB). If dA was less than dB, the lap at the location bin was classified as trial type A, and vice versa for trial type B.

