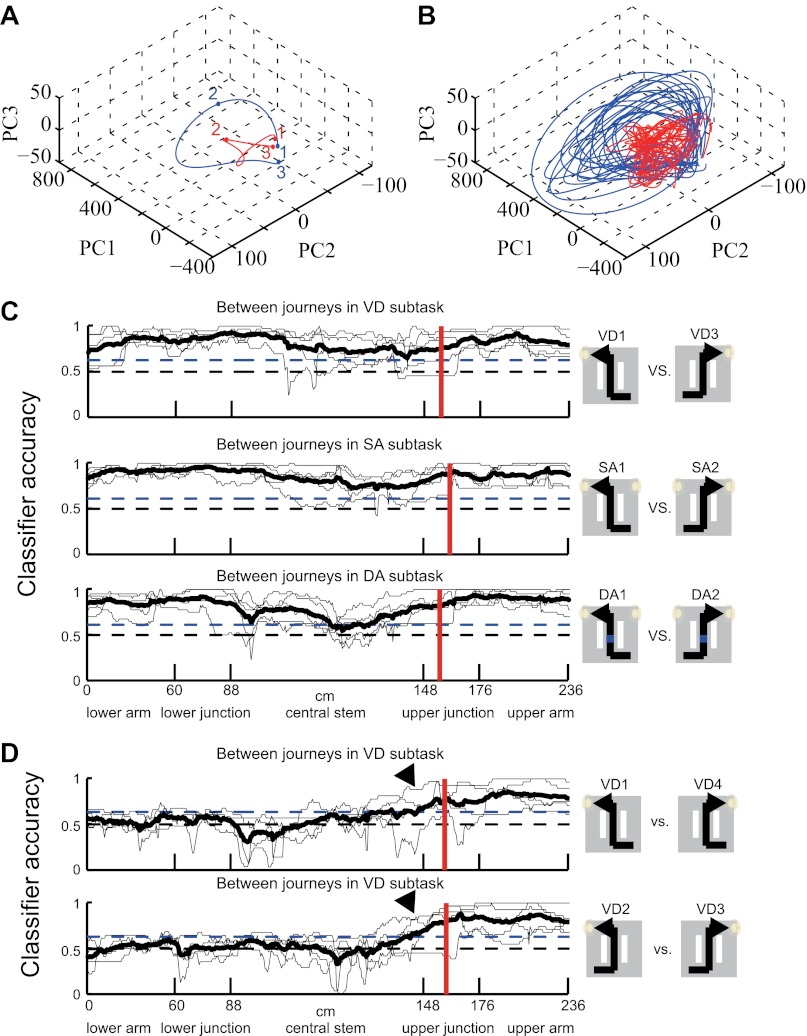
Figure 6. Neuronal trajectory of different journeys and different future directions.
(A) An example time course of mean, journey-specific trajectories for right-to-left (red) and left-to-right (blue) laps in the SA subtask, plotted on the first to third principal component space (Rat #: B120303, n = 91 cells). The points marked 1, 2 and 3 correspond to the mean locations where the rat entered the lower arm, and turned and entered the reward zone, respectively. (B) Example individual trajectories for laps in the subtask in (A). (C) The classification accuracy of determining the journeys (shown in right) at different locations in the VD, SA, and DA subtasks (thin black line, n = 5 rats; solid black line, mean; blue dashed line, p=0.001, binomial test; black dashed line, chance level; red vertical line, mean turn onset). The classifier was based on a distance-dependent classification scheme. (D) As (C), except that the subtask condition under which the future direction is not predictable until arriving at the decision point. A high level of accuracy can be observed even before the onset of the turn (arrow heads).

