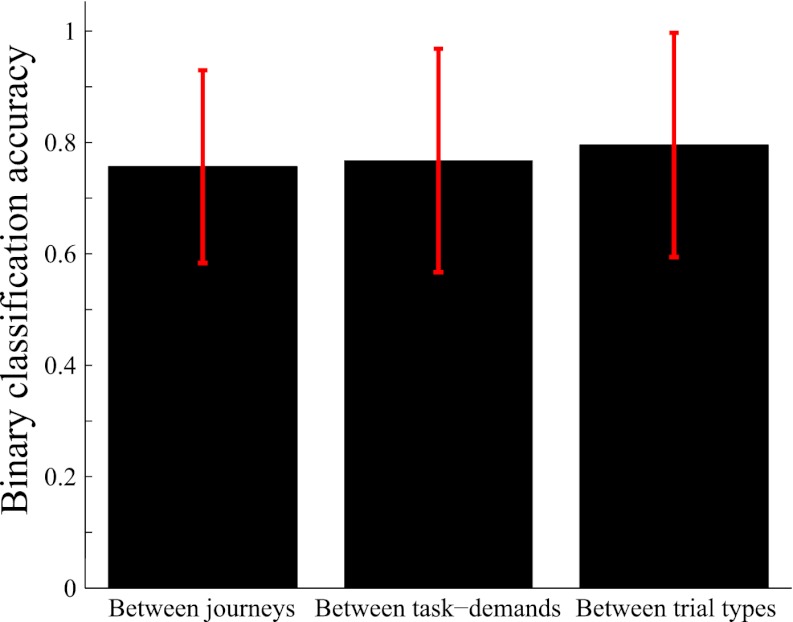
Figure 8. Comparison of accuracy of distinguishing journeys, task-demands and trial types from neuronal ensemble activity.
Average binary classification accuracies of distinguishing pairs of journeys (i.e., VD1, SA1, and DA1 vs VD3, SA2, and DA2), pairs of task-demands (i.e., VD vs SA, VD vs DA, and SA vs DA), and pairs of trial types (i.e., all possible pairings of VD1, VD2, VD3, VD4, SA1, SA2, DA1, and DA2). For each rat, the accuracy was calculated based on the most frequently classified choices in the central stem. The error bars indicate SD.

