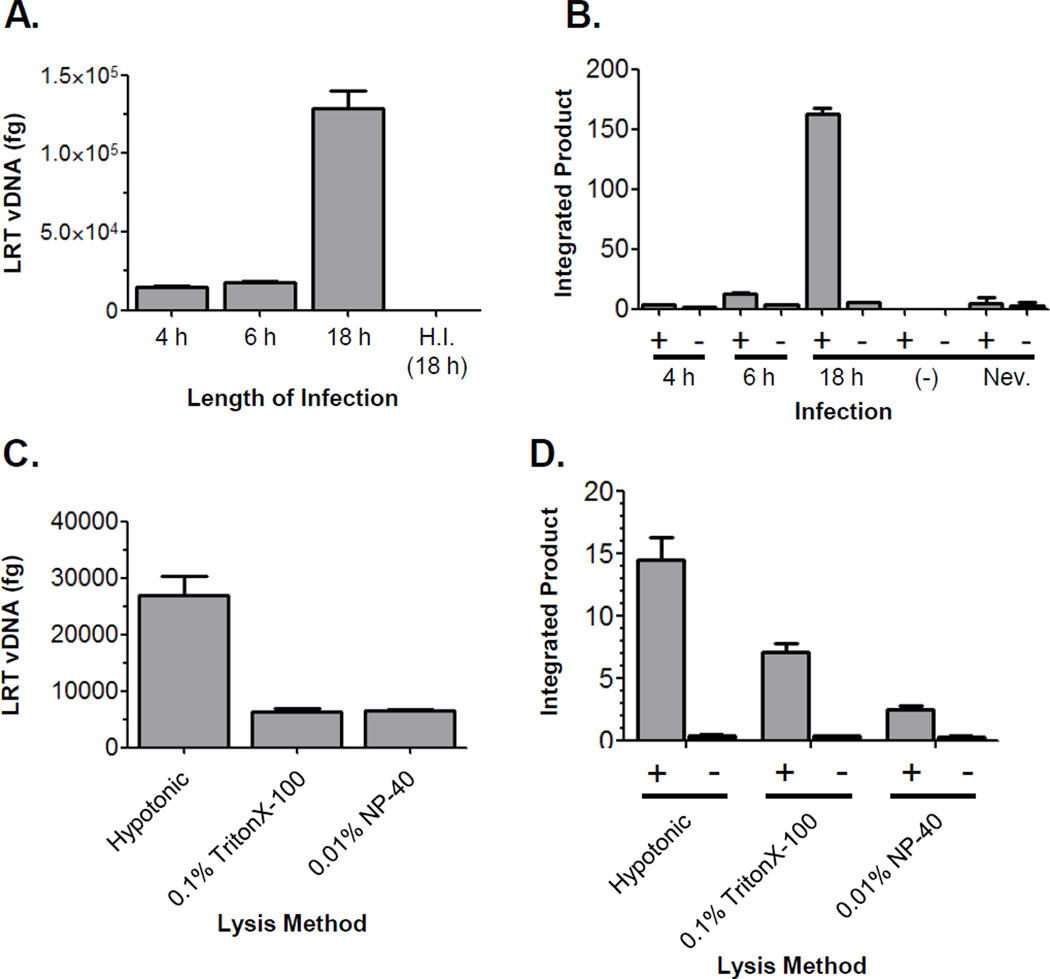
Figure 1. Assessment of infection length and extraction method.
(A) Recovery of LRT vDNA at various times post infection. DNA was isolated from cell lysates obtained by hypotonic swelling and Dounce homogenization at the indicated times post infection. DNA extractions were normalized by quantification of mitochondrial DNA (data not shown) and viral DNA levels quantified by real-time PCR using gag-specific primers. H.I.= control infection with virus heat inactivated at 65°C for 30 min. Data is representative of two independent experiments. (B) Total level of PIC activity recovered by hypotonic swelling and Dounce homogenization at various times post-infection. The levels (fg) of integrated products were determined by real-time PCR for reactions performed in the presence (+) and absence (−) of target DNA. PICs were harvested from infected C8166-45 cells at the times indicated; (−)= control reaction with uninfected lysates; Nev.= reaction with lysate from cells treated with 20 mM nevirapine. Data shown is representative of three independent experiments. (C) Recovery of vDNA from lysates extracted using the indicated methods. A single infection was split into equivalent amounts, DNA isolated, and LRT vDNA quantified by real-time PCR. Plot is representative of three independent experiments. (D) Total integration activity recovered from lysates extracted by the indicated methods. Data is representative of three independent experiments. In all experiments the error bars denote the standard deviation of the representative experiment.

