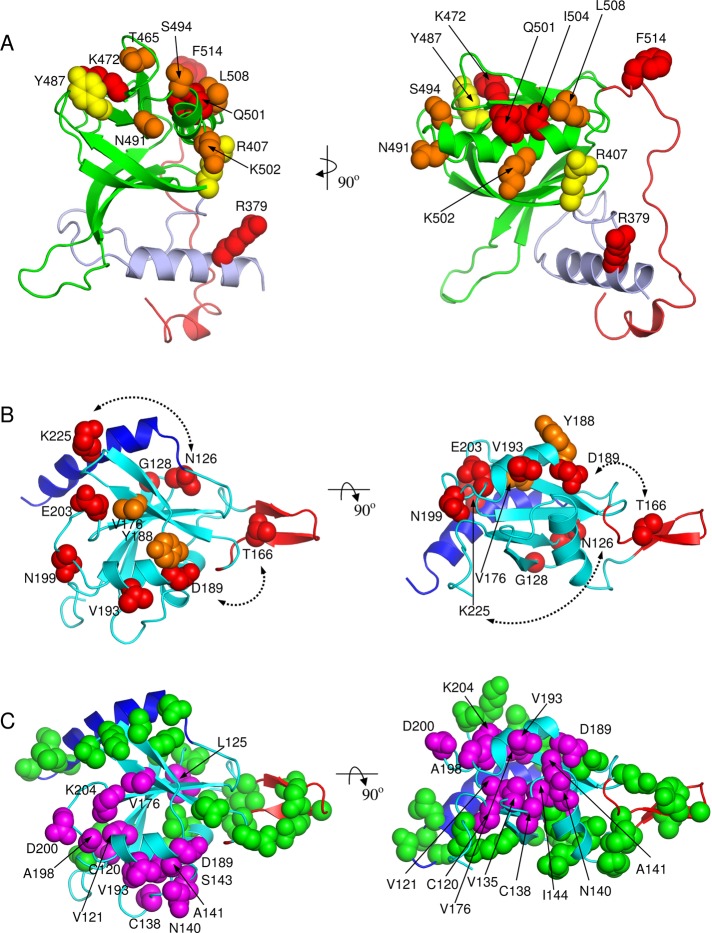
FIGURE 5:
Structural mapping of functional data. (A) Mutagenesis data (Table 1) mapped on the modeled PHSte5 domain. Mutated residues are shown as CPK models color coded by activity change upon mutation relative to wild-type Ste5: red, <<0.1% mating activity and no Ste11 binding; orange, <1% mating activity and severely decreased Ste11 interaction; yellow, ∼10% mating activity and decreased Ste11 interactions. (B) Mutagenesis data (Table 2) mapped on the solution NMR structure of the RBLSte11 domain. Mutated residues are shown as CPK models color coded by activity change upon mutation relative to wild-type Ste11: red, <<0.1% mating activity; orange, <1% mating activity. Dashed lines indicate double mutants. (C) NMR interaction data mapped on the solution NMR structure of the RBLSte11 domain. CPK models indicate residues affected (in magenta, labeled) and not affected (in green, not labeled) upon binding to PHSte5 domain. Two orthogonal views are presented in each case corresponding to those in Figure 2.

