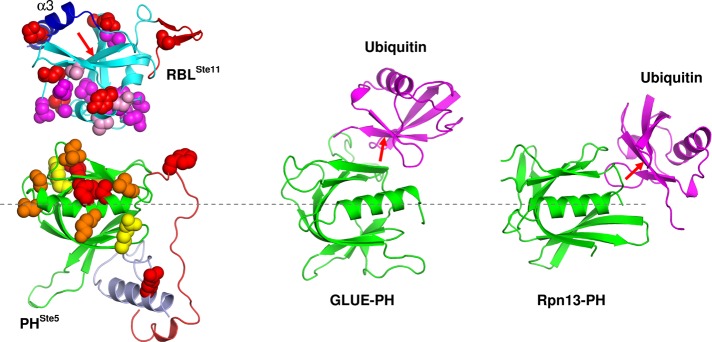
FIGURE 7:

Comparison of the inferred interface between the RBLSte11 and PHSte5 domains with other known ubiquitin–PH domain complexes. Here PH domains are structurally aligned between these complexes (dashed line through the axis of the αC helix). RBLSte11-domain and PHSte5-domain interacting surfaces mapped in this study are indicated by CPK models. Functional residue color coding is as in Figure 5 for the PHSte5 domain, whereas in the case of the RBLSte11 domain all residues mapped by mutagenesis are in red, those mapped by NMR-based interaction are in magenta, and those mapped by both mutagenesis and NMR are in purple. The orientation of the RBLSte11 domain relative to the PHSte5 domain was generated manually and is only suggestive of a putative docking approach between these domains based on functional data. The PH domains (shown in green) of both GLUE and Rpn13 appear to interact with the ubiquitin fold (shown in magenta) at partially overlapping but distinct surfaces relative to the PHSte5-domain interaction with the RBLSte11 domain. The red arrow indicates the “Ile44 face” of the fold, which is engaged in interactions of ubiquitin with GLUE-PH and Rpn13-PH domains but is blocked by a C-terminal helix (α3) in the RBLSte11 domain.
