
FIGURE 2:
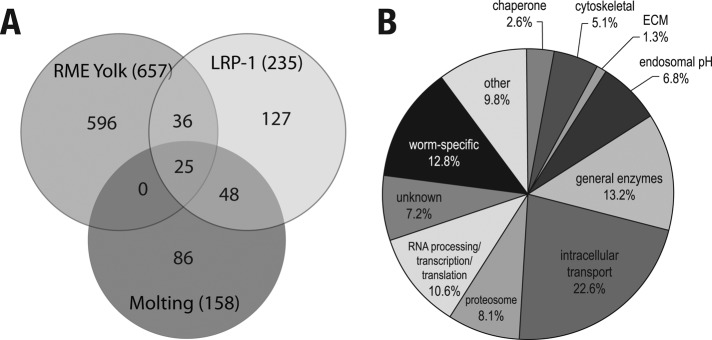
Distribution of genes identified using the two-step LRP-1::GFP transport screen. (A) Venn diagram indicating the number of unique and overlapping genes identified from C. elegans screens for genes involved in molting (Frand et al., 2005) and yolk uptake in oocytes (Balklava et al., 2007). Numbers in parentheses indicate the total number of genes identified. (B) Functional grouping of genes identified in the screen (see Table S2).