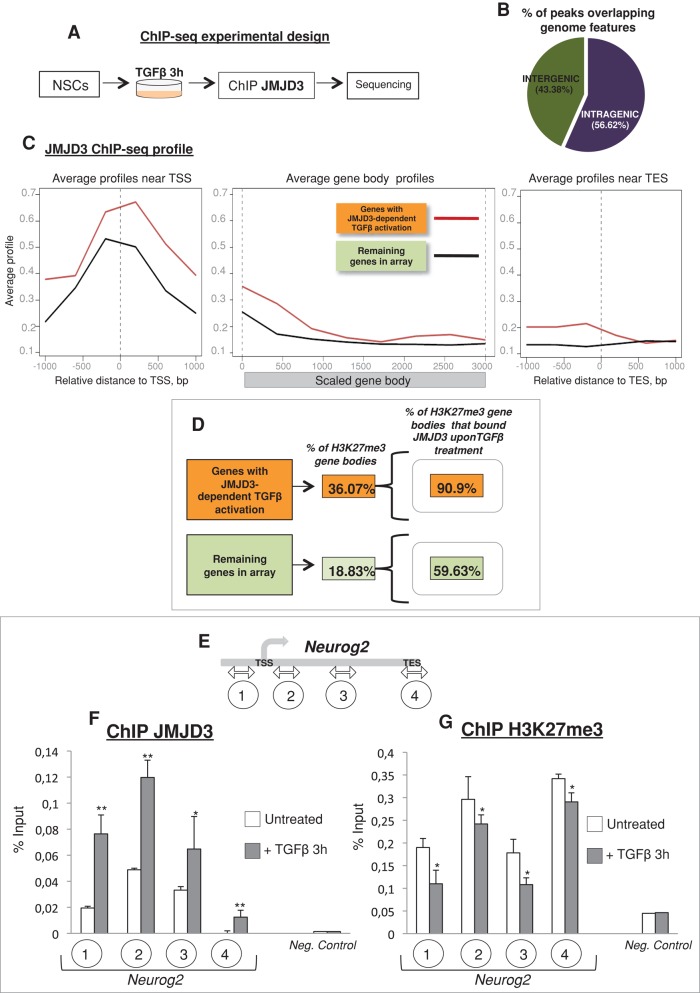
FIGURE 2:
JMJD3 is recruited to the intragenic regions upon TGFβ signal. (A) The ChIP-seq experimental procedure. (B) Genomic distribution of JMJD3-binding sites in TGFβ-stimulated NSCs. (C) Metagene profiles of JMJD3 coverage for JDTA genes and for the remaining genes in the array (orange and green boxes, respectively) in TGFβ-stimulated NSCs. (D) Middle, schematic representation showing percentage of genes with H3K27me3 peaks within JDTA genes (orange box) or the remaining genes in the array (green box). Right, percentage of H3K27me3-enriched gene bodies bound by JMJD3 for JDTA genes (orange box) or for the remaining genes in the array (green box). (E) Schematic representation of the neurogenin 2 locus. The encircled numbers under the scheme indicate the location of the primer sets used in the ChIP experiments. (F, G) JMJD3 (F) and H3K27me3 (G) ChIP assays analyzed by qPCR performed in NSCs untreated (white bars) or TGFβ treated (3 h; gray bars). Regions analyzed for the neurogenin 2 locus and the negative control gene (G6pd2) are indicated in the x-axis. Mock (immunoglobulin G ChIP) signals were subtracted from specific enrichment values. Three biological replicates were used in each ChIP experiment. Error bars indicate SD. *p < 0.05; **p < 0.01.

