FIGURE 1:
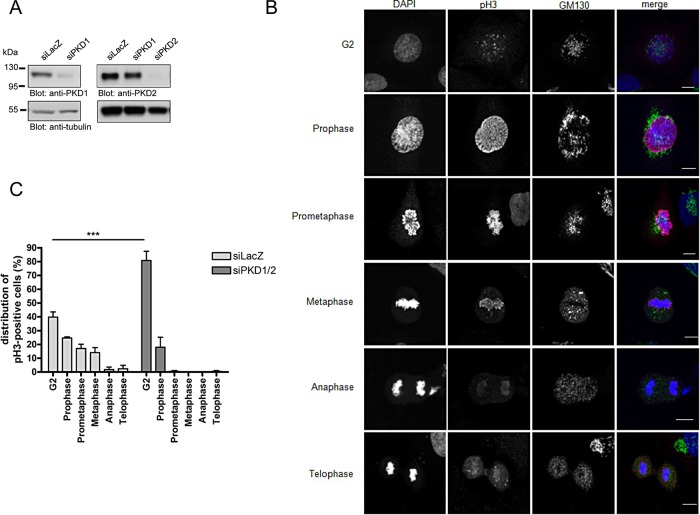
Depletion of PKD induces an accumulation of HeLa cells in G2. HeLa cells were transfected with siLacZ as a control or PKD1- and PKD2-specific siRNAs and cultured for 72 h. (A) Cells were lysed, and expression of PKD1 and PKD2 was analyzed by Western blot analysis using specific antibodies. Detection of tubulin served as a loading control. (B, C) Cells were fixed and stained with a GM130-specific antibody to visualize the Golgi, pHistone 3 (Ser-10)–specific antibody, and DAPI to visualize the nucleus. (B) Localization pattern of pH3 and GM130 (Golgi marker) during G2 and mitosis in control cells. Scale bar, 10 μm. (C) pH3-positive cells were further classified into the different cell cycle phases based on the specific pH3 localization pattern. Shown is the mean ± SEM of three independent experiments. Statistical analysis was performed using two-way analysis of variance (ANOVA) followed by a Bonferroni post test. ***p < 0.001.

