FIGURE 3:
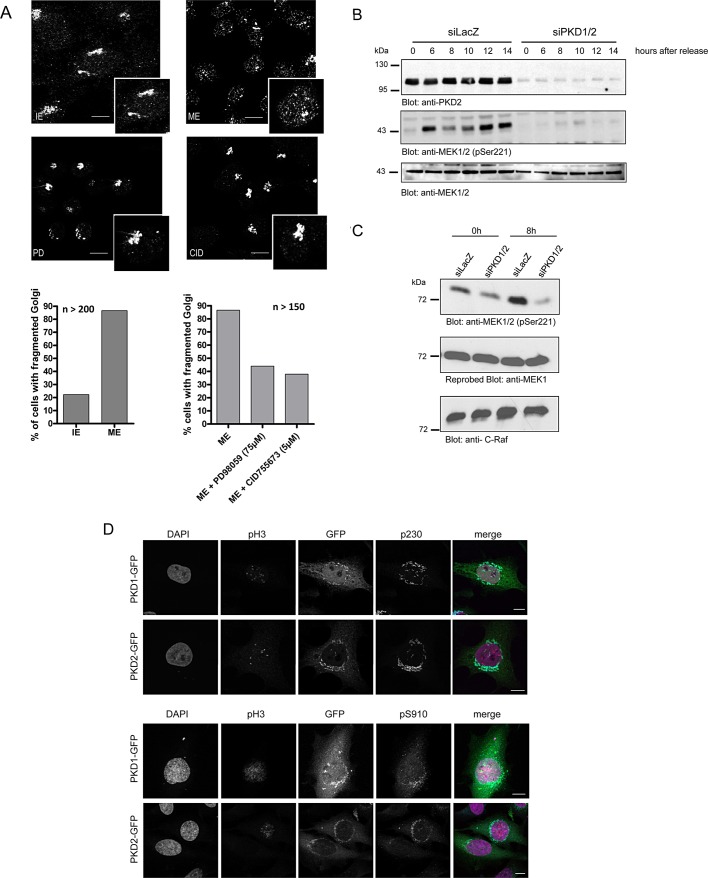
PKD is upstream of the Raf–MEK1 signaling pathway in mitotic Golgi fragmentation. (A) HeLa cells were grown on coverslips and synchronized with thymidine for 8 h at 37°C. Cells were then permeabilized by digitonin treatment and washed with 1 M KCl in KHM. Afterward the cells were incubated with interphase extract (IE) or mitotic extract (ME) or mitotic extract pretreated with the MEK1 inhibitor PD 98059 (PD; 75 μM) and the PKD inhibitor CID 755673 (CID; 5 μM), respectively, and an ATP-regenerating system at 32°C for 1 h. The organization of Golgi membranes was monitored by fluorescence microscopy using a mannosidase II–specific antibody. Shown are representative images. Scale bar, 10 μm. Left graph, percentage of cells with dispersed Golgi membranes after incubation with interphase or mitotic extract (n = 200 cells/sample). Right graph, percentage of permeabilized cells after incubation with mitotic extract pretreated with PD 98059 or CID 755673 (n = 150 cells/sample). (B) HeLa cells transfected with a control siRNA (siLacZ) or PKD1- and PKD2-specific siRNAs were synchronized at the G1/S border by a double-thymidine treatment and released for the indicated times. Cells were lysed, and phosphorylation of MEK1 was detected by Western blot analysis using an antibody specific for phosphorylated serine 221. Lysates were also analyzed using a MEK1-specific antibody to ensure that total protein levels were unchanged. Successful knockdown of PKD2 was shown with a PKD2-specific antibody. Shown is a representative experiment (n = 3). (C) HeLa cells transfected with a control siRNA (siLacZ) or PKD1- and PKD2-specific siRNAs were synchronized at the G1/S border by a double-thymidine treatment and immediately harvested (0 h) or released for 8 h before analysis. Cells were lysed, and C-Raf kinase activity was determined as described in Materials and Methods. MEK1 phosphorylation was monitored using the pS221 antibody, and MEK1 and Raf-1 levels were visualized using specific antibodies as indicated. (D) HeLa cells transiently transfected with plasmids encoding PKD1-GFP or PKD2-GFP were synchronized at the G1/S border by aphidicolin treatment and released for 8 h before analysis. Cells were fixed and stained with antibodies specific for pH3 (red) and p230 (cyan, top) or pH3 and pS910 (cyan, bottom). Localization of PKD-GFP fusion proteins is shown in green. The nucleus was visualized with DAPI (pink). Scale bar, 10 μm.

