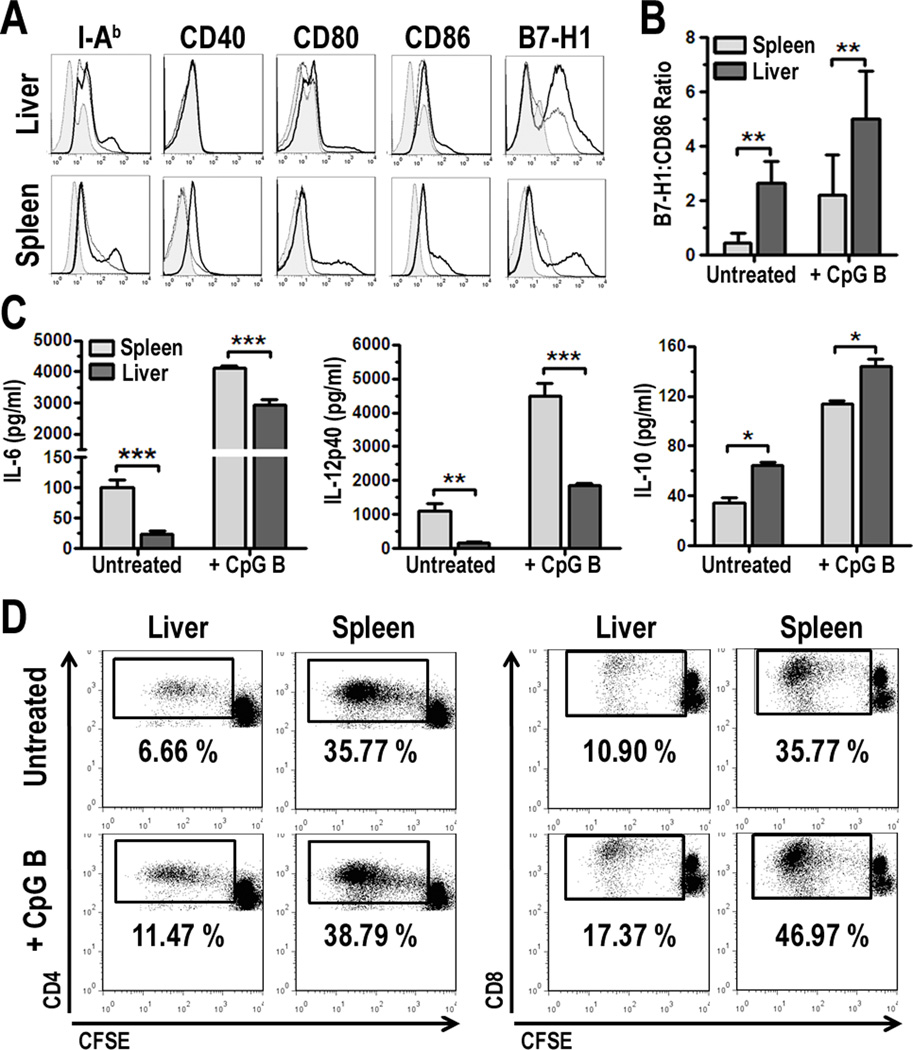
FIGURE 1.
Liver and spleen pDC differ in phenotype and function. A, B6 pDC were mobilized in vivo using Flt3L and enriched from total liver non-parenchymal cells or splenocytes as described in the Materials and Methods. PDCA-1-purified pDC were cultured in the absence or presence of 1 µg/ml CpG B ODN for 18 h, collected and analyzed by 5-color flow cytometry. Surface molecule expression was analyzed on B220+CD11clow cells. Isotypes are represented by the gray-filled histograms, unstimulated cells (thin line), and CpG B-stimulated (bold line). Data are representative of 6 independent experiments; B, The relative mean fluorescence intensities (MFI) [Sample MFI – Isotype MFI] for B7-H1 was divided by the MFI for CD86 to generate the B7-H1:CD86 ratio. Data were averaged from 4 independent experiments; C, Culture supernatants from cells analyzed in Fig. 1A were harvested and cytokines quantified by ELISA. Data represent 3 independent experiments; D, Liver or spleen pDC were cultured with CFSE-labeled, allogeneic BALB/c T cells for 3 d. Cultures were harvested and proliferation quantified by flow cytometry. Data represent 5 independent experiments, * p < 0.05, ** p< 0.01, ***p < 0.001.

