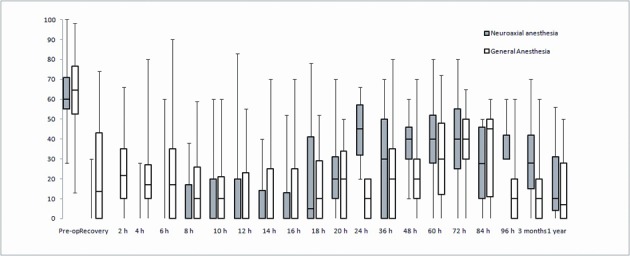
Figure 2.

Pain scores for GA and NA groups. Line within the boxes indicate median and the boxes indicate 25-75% interquartile range (IQR). Whiskers indicate range. Area under the curve analyzed for 0 - 12, 12 - 24 and 24 - 48 hrs using Mann-Whitney test. Statistically significant differences (higher pain scores in RA group) between 0 - 12 hrs, P < 0.01 and (higher scores in NA group) between 12 - 24 hrs, P < 0.05.
