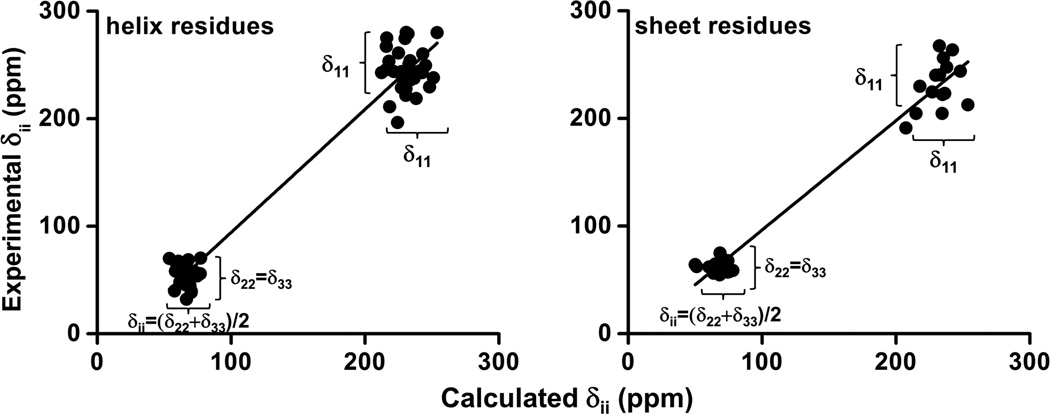
Figure 6. Linear regression plots between the calculated principal components of amide-15N CSA tensors and the corresponding experimental components for alpha-helix and sheet residues.
Linear correlation curves between calculated and experimental amide-15N CSA tensor components for alpha-helix (left) and beta-sheet (right) residues of cytb5. The parameters obtained from the regression lines are: slope = 1.14±0.03 (helix) and 1.01±0.04 (beta-sheet), and the Pearson’s coefficient (r), for residues both in helix and beta-sheet is 0.98.

